Cardano looks for a rebound after losing 10% in the last seven days.The price is currently looking indecisive across trading pairs.It may breakdown if the immediate support fails to hold incoming pressure.ADA/USD: Cardano Looking For A ReboundKey Resistance Levels: %excerpt%.085, %excerpt%.088, %excerpt%.0917Key Support Levels: %excerpt%.074, %excerpt%.0688, %excerpt%.0631After breaking out from a channel to %excerpt%.091 earlier this month, Cardano dropped and started to suspended short-term bullish sentiment. However, the trend is still considered positive on a mid-term perspective.Following this pullback, the price is now trading near the grey-marked demand area of %excerpt%.074 level that suppressed bears for the past few days now. At the same time, it is looking for a rebound on the upper boundary of the channel that got broken in late
Topics:
Michael Fasogbon considers the following as important: ADABTC, ADAUSD, Cardano (ADA) Price, Price Analysis
This could be interesting, too:
Jordan Lyanchev writes Cardano (ADA) Surpasses Dogecoin After 55% Surge
Jordan Lyanchev writes Trump Confirms Work on Strategic Crypto Reserve: XRP, ADA, SOL Included
Dimitar Dzhondzhorov writes Millions of ADA Sold by Cardano Whales During Market Crash – Will the Decline Continue?
Jordan Lyanchev writes Here’s How Cardano’s 17% Weekly Correction Can Help ADA Hit This Cycle: Analyst
- Cardano looks for a rebound after losing 10% in the last seven days.
- The price is currently looking indecisive across trading pairs.
- It may breakdown if the immediate support fails to hold incoming pressure.
ADA/USD: Cardano Looking For A Rebound
Key Resistance Levels: $0.085, $0.088, $0.0917
Key Support Levels: $0.074, $0.0688, $0.0631
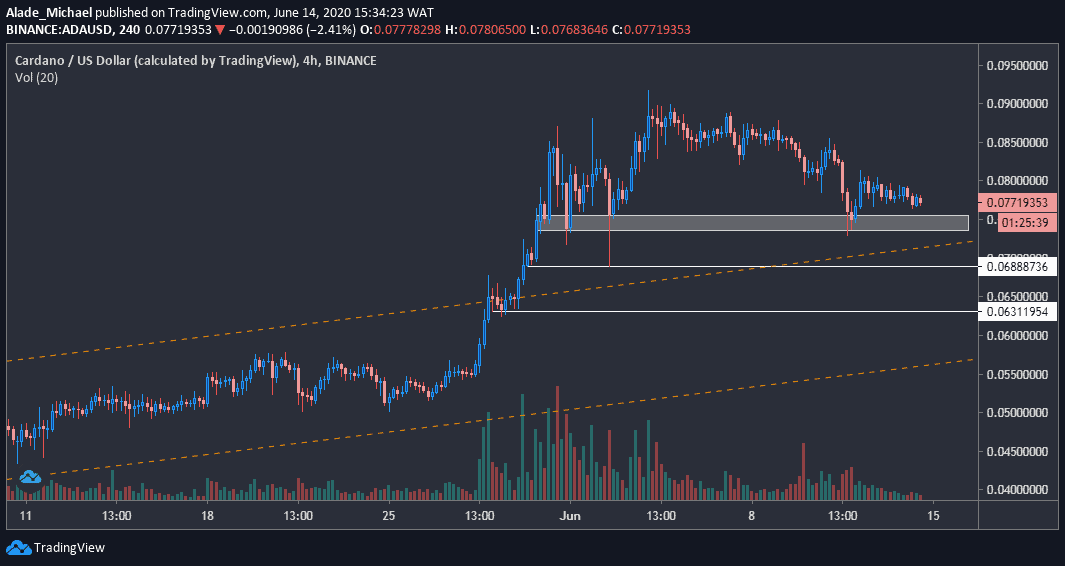
After breaking out from a channel to $0.091 earlier this month, Cardano dropped and started to suspended short-term bullish sentiment. However, the trend is still considered positive on a mid-term perspective.
Following this pullback, the price is now trading near the grey-marked demand area of $0.074 level that suppressed bears for the past few days now. At the same time, it is looking for a rebound on the upper boundary of the channel that got broken in late May. Meanwhile, the last consolidation during the last 72 hours suggests incoming volatility, which may sink price the more.
But if ADA can find support around this mentioned demand area again, there’s hope for a rebound. Nonetheless, it trades around $0.078, with a small 0.08% loss since yesterday.
AD Price Analysis
While waiting for the next market developments, there’s a close support at $0.074 around the grey demand area on the 4-hours chart. The following support to watch is located at the white lines of $0.0688 and $0.0631 inside the channel.
In case of a rebound, the closest resistance to consider is $0.085, followed by $0.088 before rising further to $0.0917. An increase above this price may see the bulls push through to $0.1 on a mid-term. But as it is now, Cardano is still deciding on where to head next.
ADA/BTC: Cardano Remains Slightly Calm
Key Resistance Levels: 900 SAT, 947SAT
Key Support Levels: 777 SAT, 704 SAT

Since our previous analysis, Cardano continued to hold support above 777 SAT. However, its volatility has remained insignificant for the past five days, which indicates a low trading activity for the 10th largest cryptocurrency by market cap.
The current trading price is around 827 SAT, following a 0.24% drop in under 24 hours. Despite the slight decrease, the bullish trajectory is still valid on the 4-hours. The price would need to fall below the red ascending line (providing support) before considering a short-term reversal.
One more thing to pay attention to is the decreasing volume on the 4-hours chart, which is very significant since the beginning of the month.
ADA Price Analysis
If ADA continues to hold support at 777 SAT and manages to bounce back from there, the first resistance to keep in mind is 900 SAT. The following target would be 947 SAT that was marked as the current yearly high on June 4th.
There’s still hope for a rebound at the red ascending line, even if the current holding support breaks down. But a drop beneath this trend line would set a strong bearish tone in the market as Cardano may slip to 600 SAT. However, the closest support to watch is the 704 SAT level.