The price saw a small recovery after finding temporary support near %excerpt%.25 ~ 3000 SAT level. THETA is looking bearish on the lower time frame after losing almost 30% overnight. THETA/USD: THETA Got Exhausted At %excerpt%.25 Key Resistance Levels: %excerpt%.40, %excerpt%.50, %excerpt%.588 Key Support Levels: %excerpt%.25, %excerpt%.20, %excerpt%.137 THETA/USD. Source: TradingViewThe last 24-hour drops in THETA’s price appeared to have reached exhaustion – with a pin bar – near a key demand area of %excerpt%.25 today following a quick 7-day pump to around %excerpt%.588 yesterday. The 30% discount has provided a good opportunity for short-term bulls. THETA is now trading as low as %excerpt%.336 against the US Dollar. Currently, bulls are struggling to push through the %excerpt%.35 level as recovery may hold for a while if this level continues to suppress bullish
Topics:
Michael Fasogbon considers the following as important: Price Analysis, theta, THETABTC, THETAUSD
This could be interesting, too:
CryptoVizArt writes ETH’s Path to K Involves Maintaining This Critical Support (Ethereum Price Analysis)
Duo Nine writes Crypto Price Analysis June-29: ETH, XRP, ADA, DOGE, and DOT
Duo Nine writes Crypto Price Analysis June-15: ETH, XRP, ADA, DOGE, and DOT
Duo Nine writes Why is the Shiba Inu (SHIB) Price Down Today?
- The price saw a small recovery after finding temporary support near $0.25 ~ 3000 SAT level.
- THETA is looking bearish on the lower time frame after losing almost 30% overnight.
THETA/USD: THETA Got Exhausted At $0.25
Key Resistance Levels: $0.40, $0.50, $0.588
Key Support Levels: $0.25, $0.20, $0.137
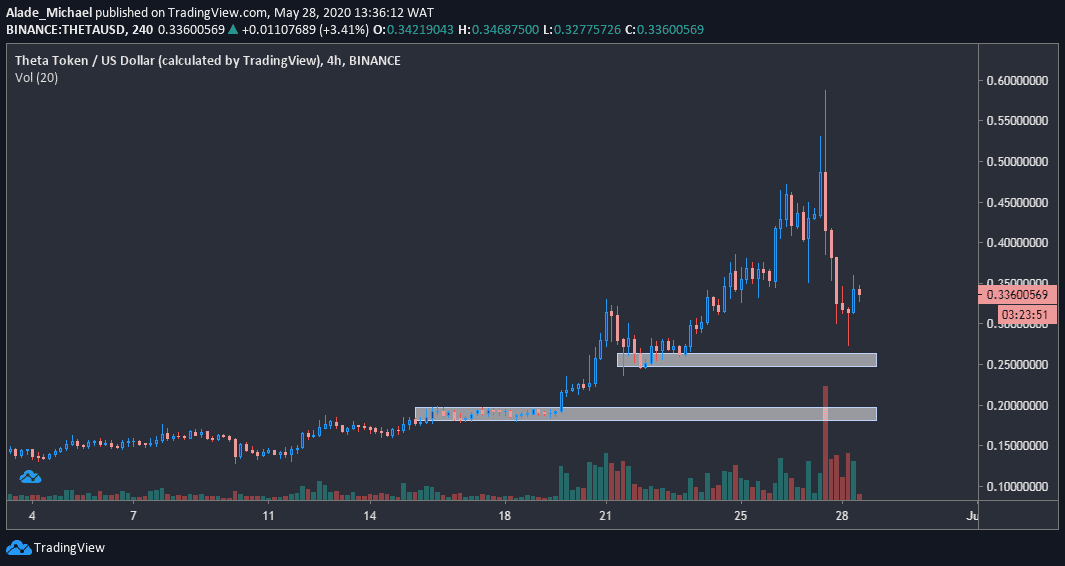
The last 24-hour drops in THETA’s price appeared to have reached exhaustion – with a pin bar – near a key demand area of $0.25 today following a quick 7-day pump to around $0.588 yesterday. The 30% discount has provided a good opportunity for short-term bulls. THETA is now trading as low as $0.336 against the US Dollar.
Currently, bulls are struggling to push through the $0.35 level as recovery may hold for a while if this level continues to suppress bullish actions.
From a technical perspective, THETA may lose control if the holding demand area breaks down. The trading volume is currently low. An expansion in volatility would determine the next major move in this market.
THETA Price Analysis
The recent exhaustion around $0.25 price area could lieu buyers back in the market if the immediate $0.35 level is breached. Once it breaks, THETA is likely to revisit the psychological resistance at $0.4 and $0.5, respectively.
A climb above these resistances should propel buying to $0.588 (yesterday’s high).
But if the price dips below the current holding level, the next target to watch out for is the $0.2 demand area – the second white spot. The following support is located at $0.137 – the current monthly low.
THETA/BTC: THETA Turns Bearish After A Breakdown
Key Resistance Levels: 4300 SAT, 5300 SAT, 4400 SAT
Key Support Levels: 3000 SAT, 2250 SAT, 1950 SAT
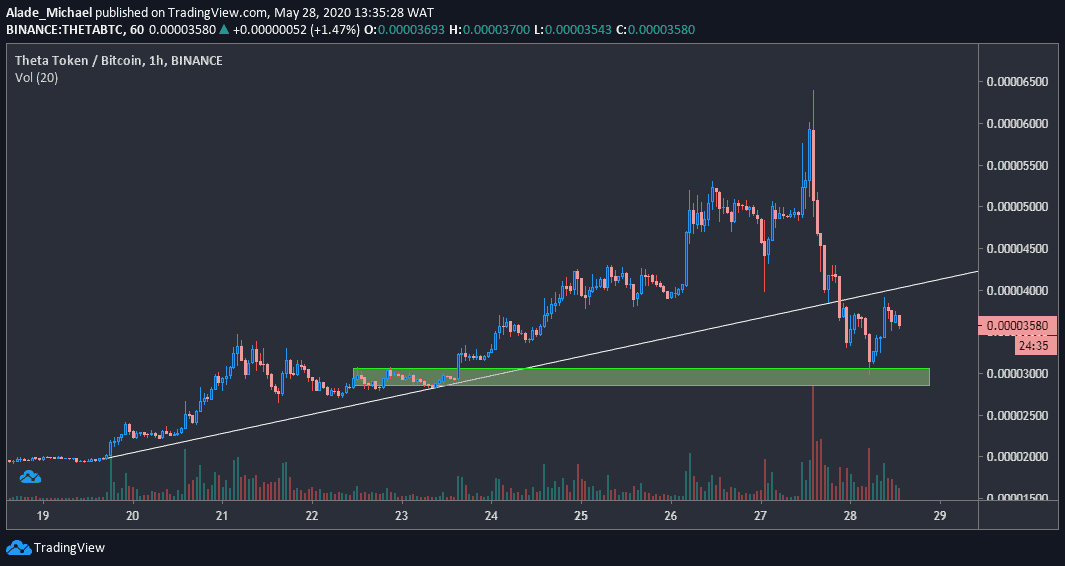
THETA is still looking bullish on the daily chart, but the 26% loss over the past hours is presenting the market bearish again on the hourly chart.
However, the bulls are showing interest at the time of writing. A slight bounce from 3000 SAT level (temporary support) has brought the current trading price to 3580 SAT against Bitcoin.
As spotted in the above chart, THETA is struggling under 3900 SAT for the past few hours now. The price may further collapse, but if the cryptocurrency can find a support level at 3300 SAT to form a right shoulder, a reversal could play out with a head-and-shoulder pattern.
Meanwhile, yesterday’s drop below the white ascending trend line is another thing to worry about on a short-term perspective. THETA might find it difficult to regain momentum if the trend line continues to act as resistance in the long run.
THETA Price Analysis
THETA found daily support at 3000 SAT level, slightly inside the green area on the hourly chart. Support below this area lies at 2250, followed by May 19 low of 1950 SAT.
For the bulls to take over, they would need to push price back above the 4000 SAT level – where the white trend line lies – before rising to 4300 SAT resistance. Further resistance can be found at 5300 SAT, followed by 6400 SAT.
A look at the current market structure suggests that the bears are much likely to resume selling pressure in the market.