XRP/USD – Bullish Explosion Leads To 17 Month HighsKey Support Levels: %excerpt%.4, %excerpt%.388, %excerpt%.378.Key Resistance Levels: %excerpt%.42, %excerpt%.44, %excerpt%.457.Today, XRP surprised everyone as it exploded by a powerful 32.5%. The cryptocurrency started the day at %excerpt%.33 as it started to push higher to reach as high as %excerpt%.44. It has since dropped slightly to trade at %excerpt%.413.The cryptocurrency had been showing signs all month that it was ready to start a bull run, but nobody could have guessed this type of price explosion was incoming. The coin had broken out of a symmetrical triangle pattern at the start of the month as it started to push higher. XRP went on to reach %excerpt%.3 by mid-week and stalled here for a few days until it broke the resistance yesterday to reach %excerpt%.33.XRP/USD Daily Chart. Source:
Topics:
Yaz Sheikh considers the following as important: Ripple (XRP) Price, XRP Analysis, xrpbtc, xrpusd
This could be interesting, too:
Jordan Lyanchev writes Ripple’s (XRP) Surge to Triggers Over Million in Short Liquidations
Jordan Lyanchev writes Trump Confirms Work on Strategic Crypto Reserve: XRP, ADA, SOL Included
Dimitar Dzhondzhorov writes Is a Major Ripple v. SEC Lawsuit Development Expected This Week? Here’s Why
Mandy Williams writes Ripple Releases Institutional DeFi Roadmap for XRP Ledger in 2025
XRP/USD – Bullish Explosion Leads To 17 Month Highs
Key Support Levels: $0.4, $0.388, $0.378.
Key Resistance Levels: $0.42, $0.44, $0.457.
Today, XRP surprised everyone as it exploded by a powerful 32.5%. The cryptocurrency started the day at $0.33 as it started to push higher to reach as high as $0.44. It has since dropped slightly to trade at $0.413.
The cryptocurrency had been showing signs all month that it was ready to start a bull run, but nobody could have guessed this type of price explosion was incoming. The coin had broken out of a symmetrical triangle pattern at the start of the month as it started to push higher. XRP went on to reach $0.3 by mid-week and stalled here for a few days until it broke the resistance yesterday to reach $0.33.
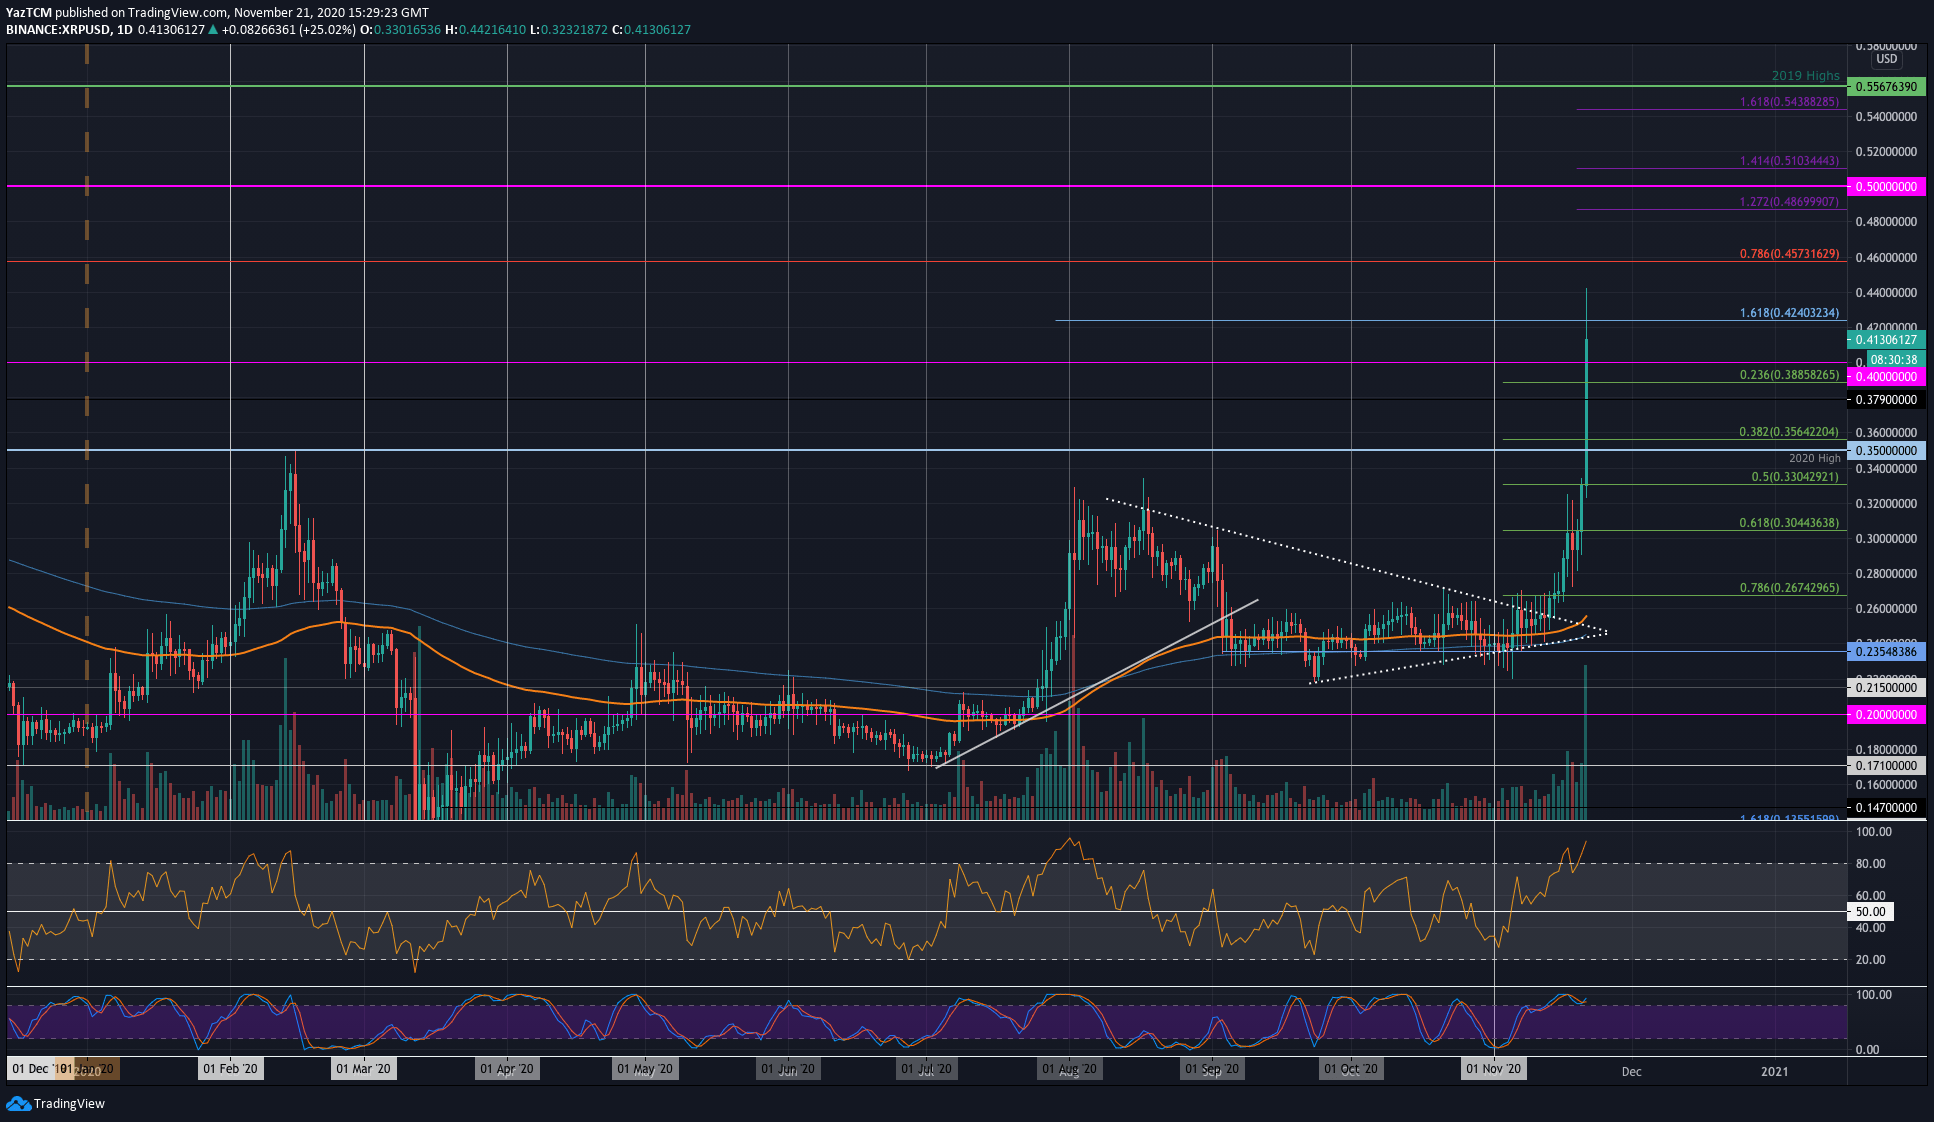
XRP-USD Short Term Price Prediction
Looking ahead, if the buyers can continue this epic bullish push, the first two levels of resistance are found at $0.42 and $0.44. Above this, resistance lies at $0.457 (bearish .786 Fib), $0.48, $0.486 (1.272 Fib Extension), and $0.5.
On the other side, if the sellers push lower, the first level of support lies at $0.4. Beneath this, support lies at $0.388 (.236 Fib), $0.378, $0.36 (.382 Fib), and $0.35 (2020 High).
As expected, both the RSI and Stochastic RSI are extremely overbought with such a powerful push in one day.
XRP/BTC – Buyers Push XRP Back To October Highs
Key Support Levels: 2100 SAT, 2035 SAT, 1945 SAT.
Key Resistance Levels: 2335 SAT, 2450 SAT, and 2545 SAT.
XRP also managed to push higher against Bitcoin today as it surged into the 2335 SAT resistance (bearish .618 Fib Retracement & October high). The coin has since dropped slightly from here as it trades at 2185 SAT (bearish .5 Fib & 200-days EMA).
This is a very promising signal for any market buyers as XRP has struggled heavily against BTC for the past 3-months running.
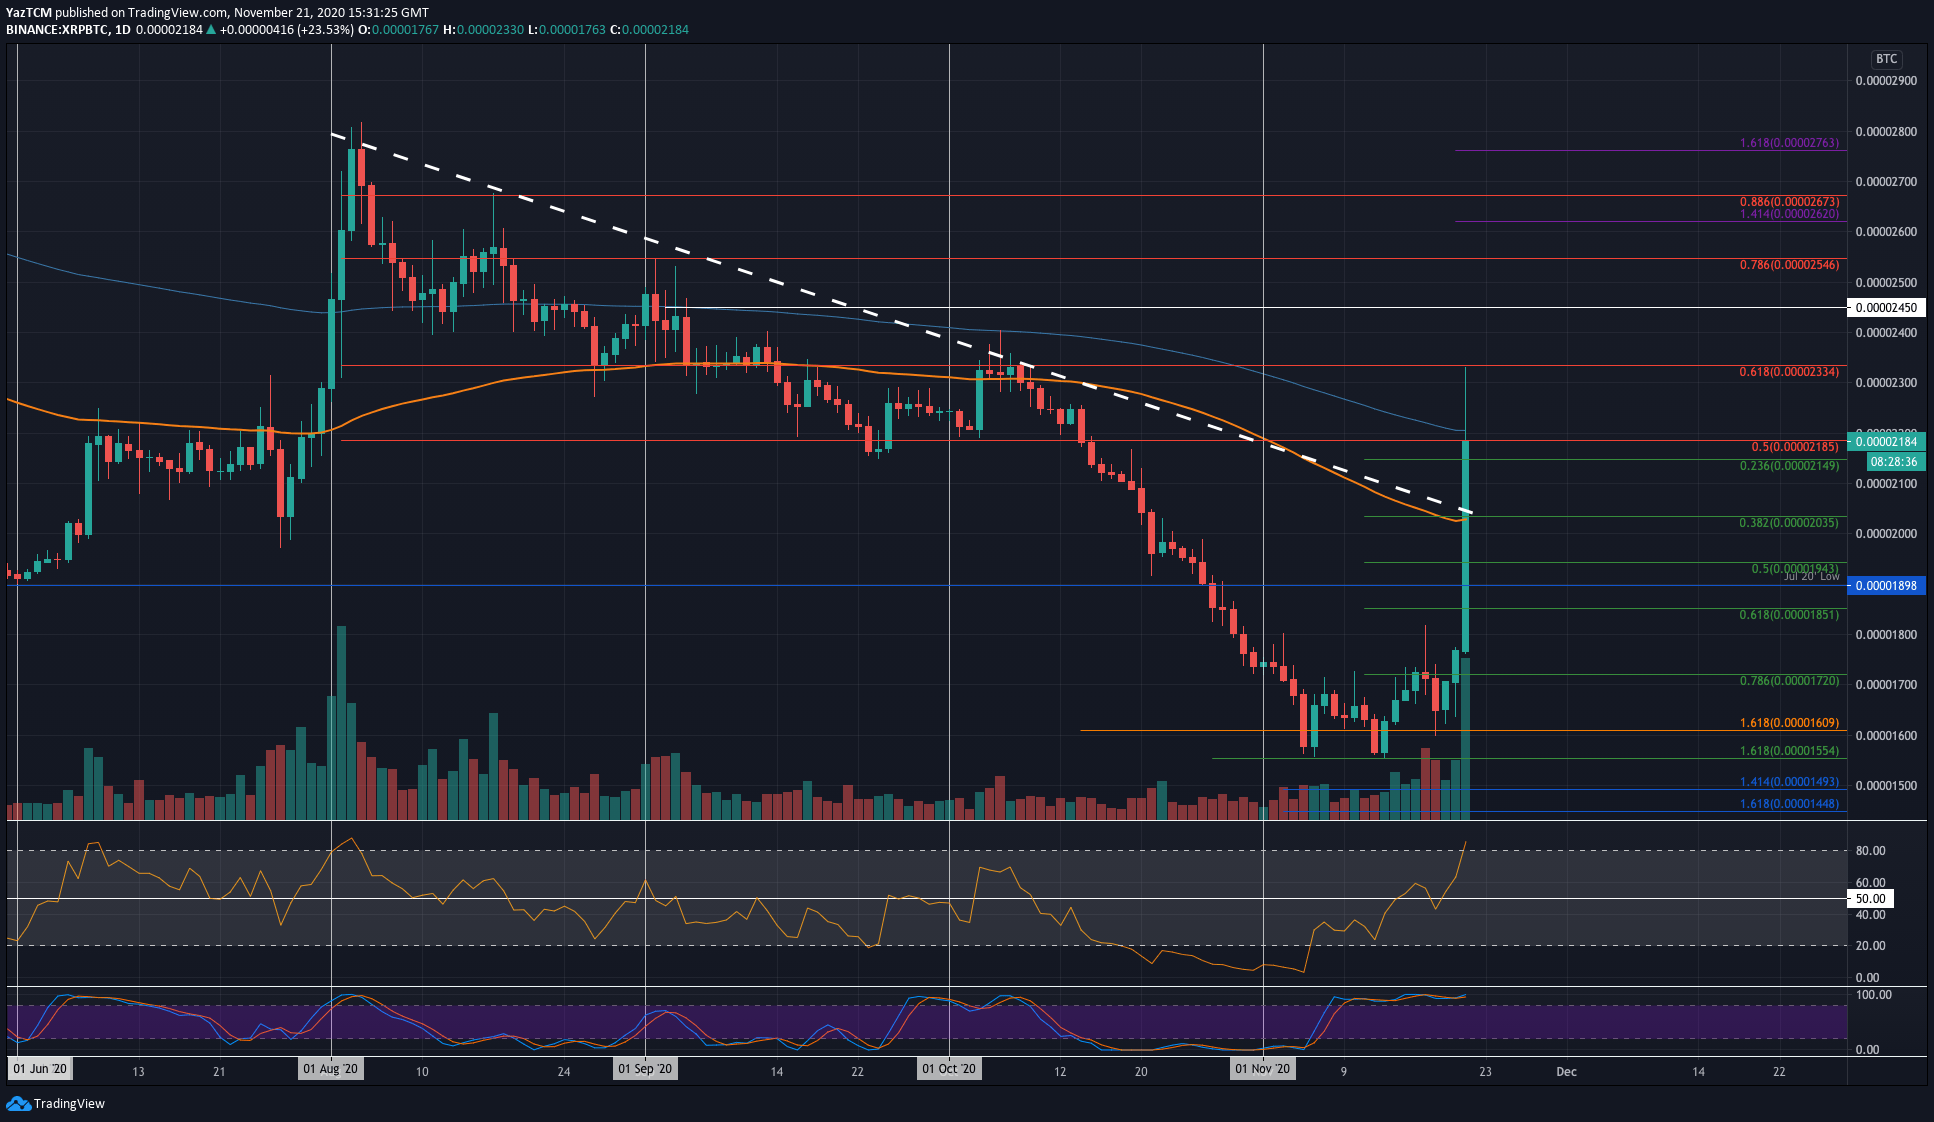
XRP-BTC Short Term Price Prediction
Looking ahead, if the bulls push back above the 200-days EMA, the first level of resistance is located at 2335 SAT (bearish .618 Fib Retracement). Above this, resistance lies at 2450 SAT, 2545 SAT (bearish .786 Fib Retracement), and 2620 SAT.
On the other side, the first level of support lies at 2100 SAT. Beneath this, support lies at 2035 SAT (.382 Fib & 100-days EMA) and 1943 SAT.
Likewise, both the RSI and Stochastic RSI are extremely overbought.