Key Support level: 6 Key Resistance level: 0, 2 (ATH) The price rallied off the 6 support level with sufficient momentum to go all the way up to the 0 resistance level. Once there, the bears rejected the price and look likely to continue to put up a good fight at this key psychological level. For this reason, BNB still lingers just under 0 at the time of this post while the bulls are considering another attempt to break above. Chart by TradingViewTechnical Indicators Trading Volume: The volume is falling, and this last rejection at 0 has cut the momentum from BNB bulls. It might take some time for them to recover and try again. RSI: The RSI fall has stopped, and it has even made higher lows. This is a positive change from last week when BNB was in a
Topics:
Duo Nine considers the following as important: Binance Coin (BNB) Price, BNBBTC, bnbusd, Price Analysis
This could be interesting, too:
Chayanika Deka writes Osprey Funds Launches First US Publicly Quoted BNB Trust
Chayanika Deka writes BNB Overtakes Solana to Secure 5th Spot by Market Cap After Historic Rally
CryptoVizArt writes ETH’s Path to K Involves Maintaining This Critical Support (Ethereum Price Analysis)
Dimitar Dzhondzhorov writes Binance to Temporarily Suspend Deposits and Withdrawals on BNB Smart Chain Soon: Here’s Why
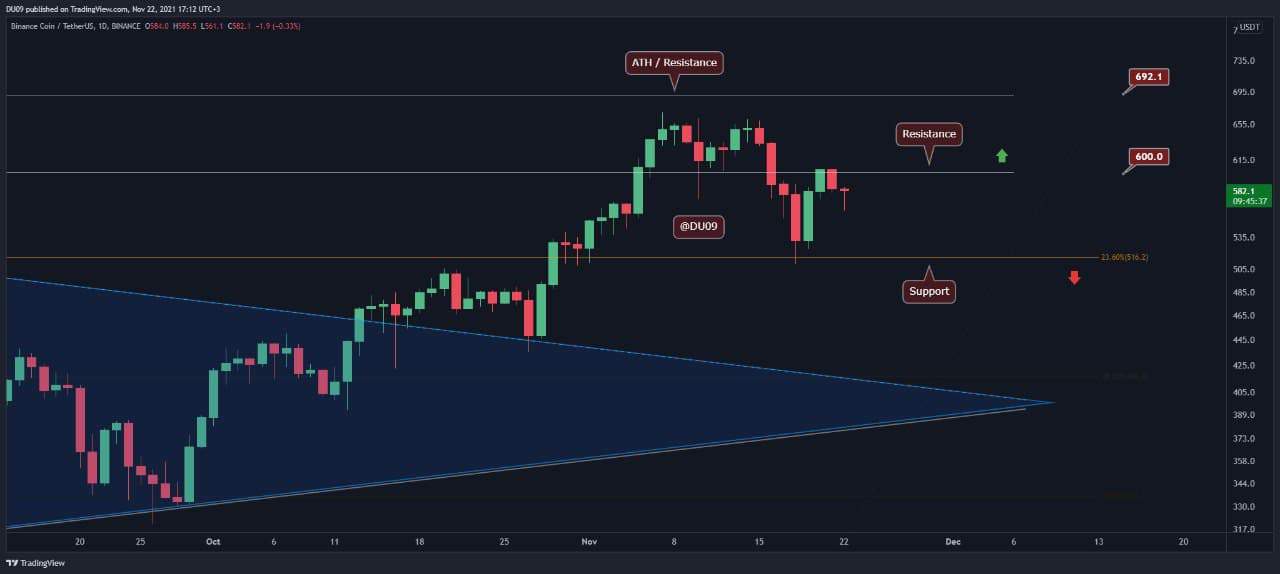
Key Support level: $516
Key Resistance level: $600, $692 (ATH)
The price rallied off the $516 support level with sufficient momentum to go all the way up to the $600 resistance level.
Once there, the bears rejected the price and look likely to continue to put up a good fight at this key psychological level. For this reason, BNB still lingers just under $600 at the time of this post while the bulls are considering another attempt to break above.
Technical Indicators
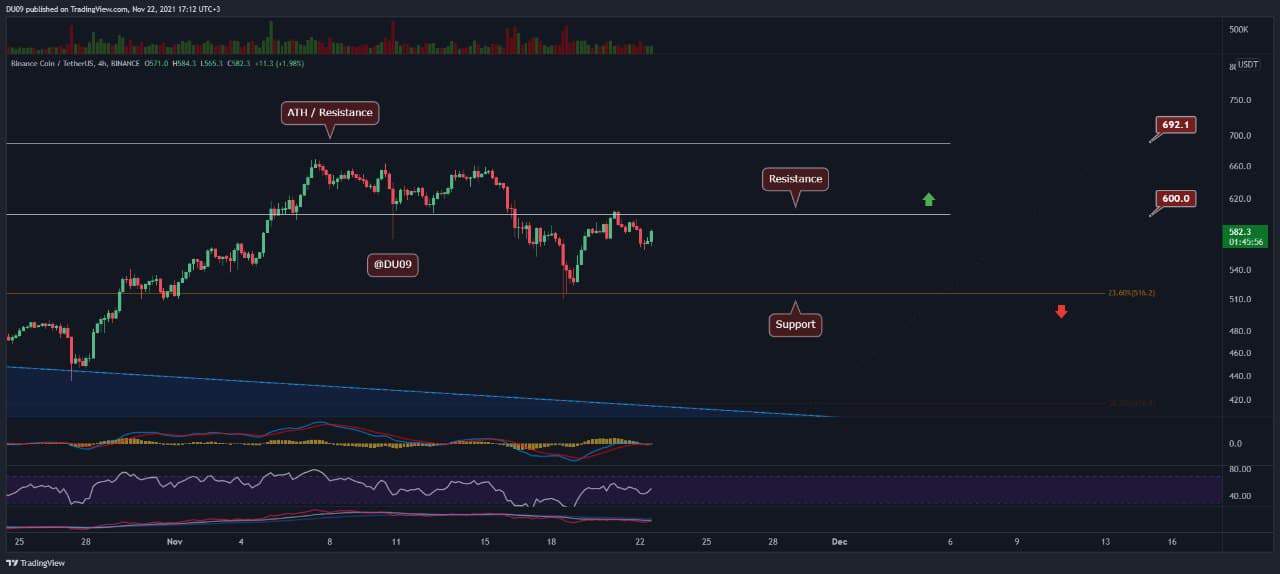
Trading Volume: The volume is falling, and this last rejection at $600 has cut the momentum from BNB bulls. It might take some time for them to recover and try again.
RSI: The RSI fall has stopped, and it has even made higher lows. This is a positive change from last week when BNB was in a freefall.
MACD: The MACD completed a bullish cross on the 4-hour timeframe last Friday, and it is now keen to do it again after a short-lived correction. On the daily timeframe, the MACD is still bearish, but the histogram is making higher lows. If bulls can break above $600, then the daily MACD will curve back up strongly.
Bias
The current bias is neutral. The market seems to be deciding on the next steps, and the price action reflects this as well. To flip the bias bullish, BNB has to break above $600. To turn bearish, it has to fall below the key support at $516.
Short-Term Prediction for BNB Price
BNB downtrend momentum has stalled, and the current price action shows that bulls are considering another attempt at the $600 resistance. Until that materializes, it’s more likely for BNB to float just under the key support.