Key Support levels: Key Resistance level: DOT had a fantastic rally last week when the price increased by 40%. However, this week, DOT’s rally ended when the resistance at rejected the price from moving higher. Today, the correction continued, and DOT has fallen under . The current support is found at . Chart by TradingViewTechnical Indicators Trading Volume: Sustained volume both during the uptrend and the current downtrend. This shows that market participants have taken quite an interest in DOT recently. RSI: The daily RSI has made a higher high during the rally, which is a strong bullish signal. However, after the rejection at , the RSI is falling. This can quickly change as soon as DOT finds support. MACD: The daily MACD is bullish, but the
Topics:
Duo Nine considers the following as important: DOTBTC, DOTUSD, Polkadot (DOT) Price, Price Analysis
This could be interesting, too:
Dimitar Dzhondzhorov writes Top 10 Cryptocurrencies by ‘Notable Development Activity’ (Santiment)
CryptoVizArt writes ETH’s Path to K Involves Maintaining This Critical Support (Ethereum Price Analysis)
Duo Nine writes Crypto Price Analysis June-29: ETH, XRP, ADA, DOGE, and DOT
Dimitar Dzhondzhorov writes Here’s Why Polkadot (DOT) Might be a ‘Great Mover in the Coming Years:’ Analyst
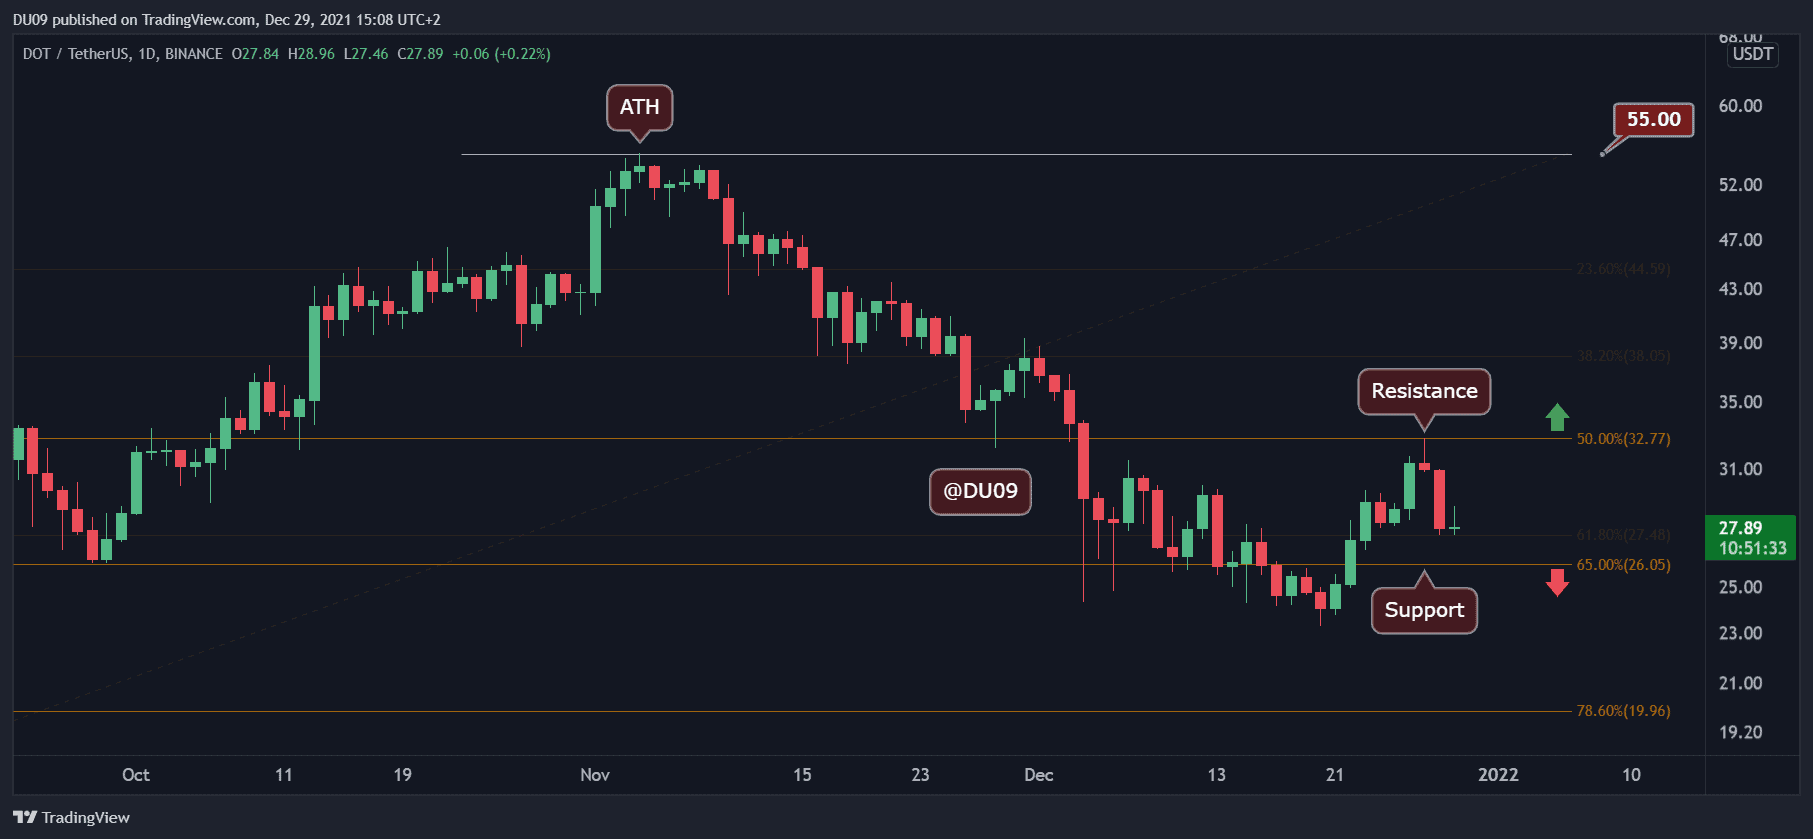
Key Support levels: $26
Key Resistance level: $33
DOT had a fantastic rally last week when the price increased by 40%. However, this week, DOT’s rally ended when the resistance at $33 rejected the price from moving higher. Today, the correction continued, and DOT has fallen under $30. The current support is found at $26.
Technical Indicators
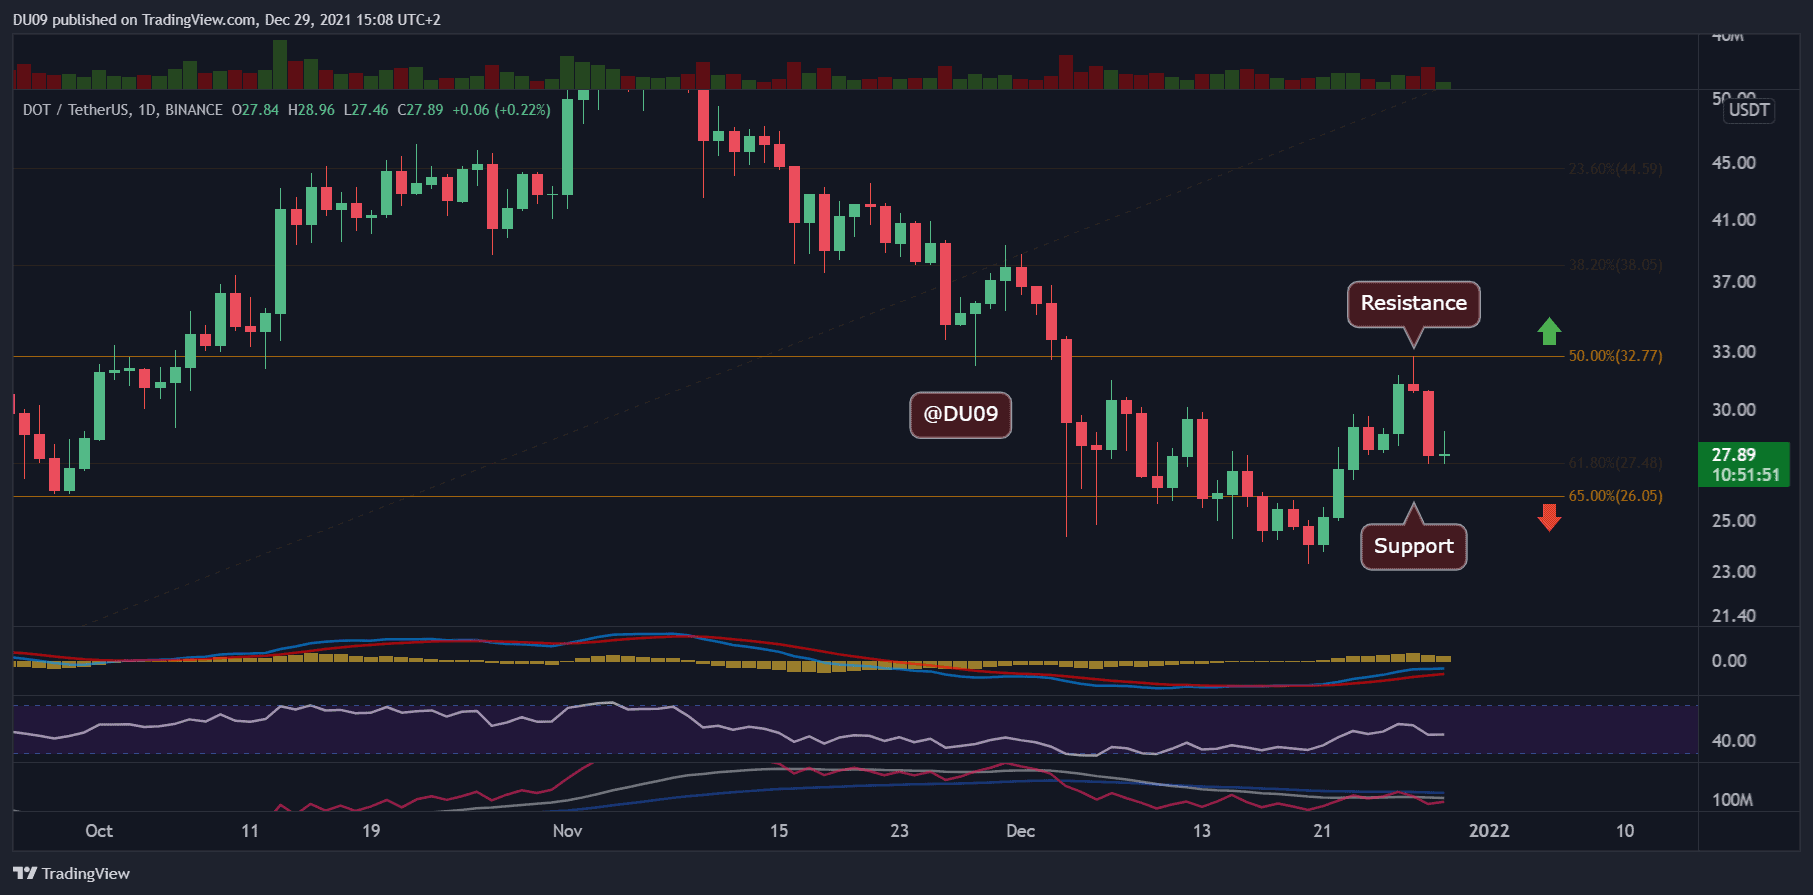
Trading Volume: Sustained volume both during the uptrend and the current downtrend. This shows that market participants have taken quite an interest in DOT recently.
RSI: The daily RSI has made a higher high during the rally, which is a strong bullish signal. However, after the rejection at $33, the RSI is falling. This can quickly change as soon as DOT finds support.
MACD: The daily MACD is bullish, but the histogram is making lower highs after the rejection at $33. This is not concerning as long as the moving averages don’t do a bearish crossover.
Bias
The current DOT bias is neutral.
Short-Term Prediction for DOT Price
DOT had a very nice recovery last week after falling for over 40 days. It is important for the price to return to the uptrend after this correction, as otherwise, the top at $33 could be interpreted as a lower high within a larger bearish trend.