Key Support levels: %excerpt%.75, %excerpt%.70 Key Resistance level: %excerpt%.89 Ever since XRP was rejected by the resistance, the price went through a continuous decline which was exacerbated by the market crash on Saturday. The support at %excerpt%.89 was turned into resistance during the crash, and the next key support level is found at %excerpt%.75. Despite this painful downtrend, XRP’s price action seems to indicate that the bulk of this correction may approach the end. Particularly because the downwards momentum is losing strength, and each subsequent red daily candle after the crash was smaller. Today’s candle, even if red, could be interpreted as a bullish hammer, which is a reversal signal. Chart by TradingViewTechnical Indicators Trading Volume: The volume has decreased after Saturday’s
Topics:
Duo Nine considers the following as important: Ripple (XRP) Price, XRP Analysis, xrpbtc, xrpusd
This could be interesting, too:
Jordan Lyanchev writes Ripple’s (XRP) Surge to Triggers Over Million in Short Liquidations
Jordan Lyanchev writes Trump Confirms Work on Strategic Crypto Reserve: XRP, ADA, SOL Included
Dimitar Dzhondzhorov writes Is a Major Ripple v. SEC Lawsuit Development Expected This Week? Here’s Why
Mandy Williams writes Ripple Releases Institutional DeFi Roadmap for XRP Ledger in 2025
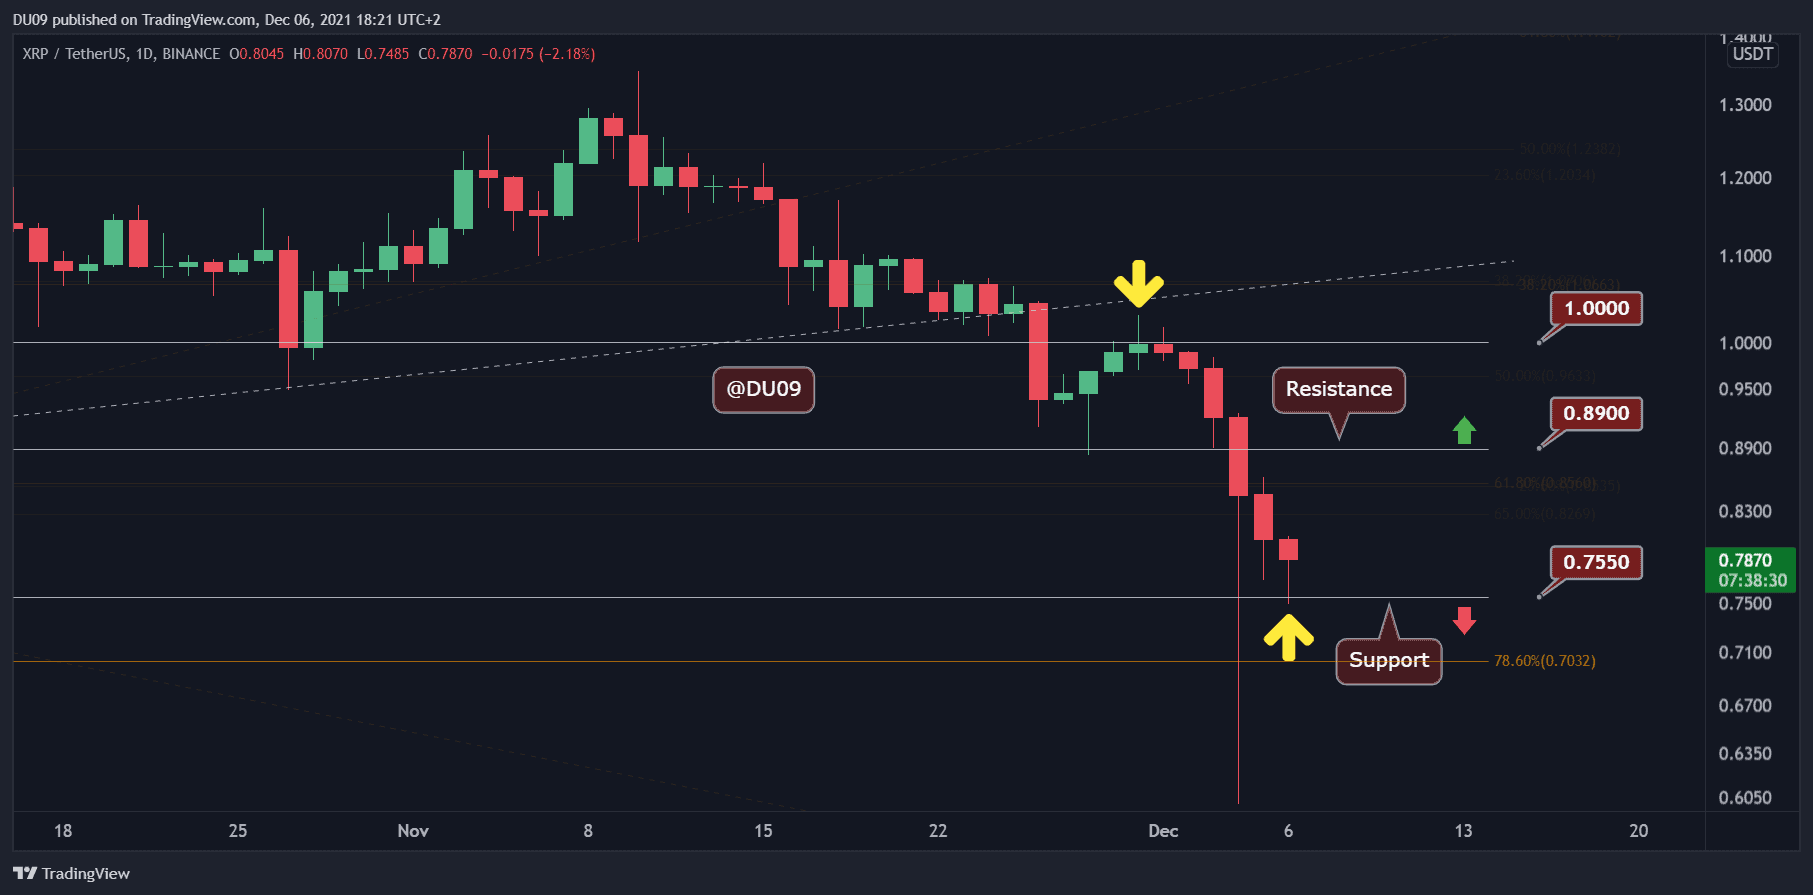
Key Support levels: $0.75, $0.70
Key Resistance level: $0.89
Ever since XRP was rejected by the $1 resistance, the price went through a continuous decline which was exacerbated by the market crash on Saturday. The support at $0.89 was turned into resistance during the crash, and the next key support level is found at $0.75.
Despite this painful downtrend, XRP’s price action seems to indicate that the bulk of this correction may approach the end. Particularly because the downwards momentum is losing strength, and each subsequent red daily candle after the crash was smaller. Today’s candle, even if red, could be interpreted as a bullish hammer, which is a reversal signal.
Technical Indicators
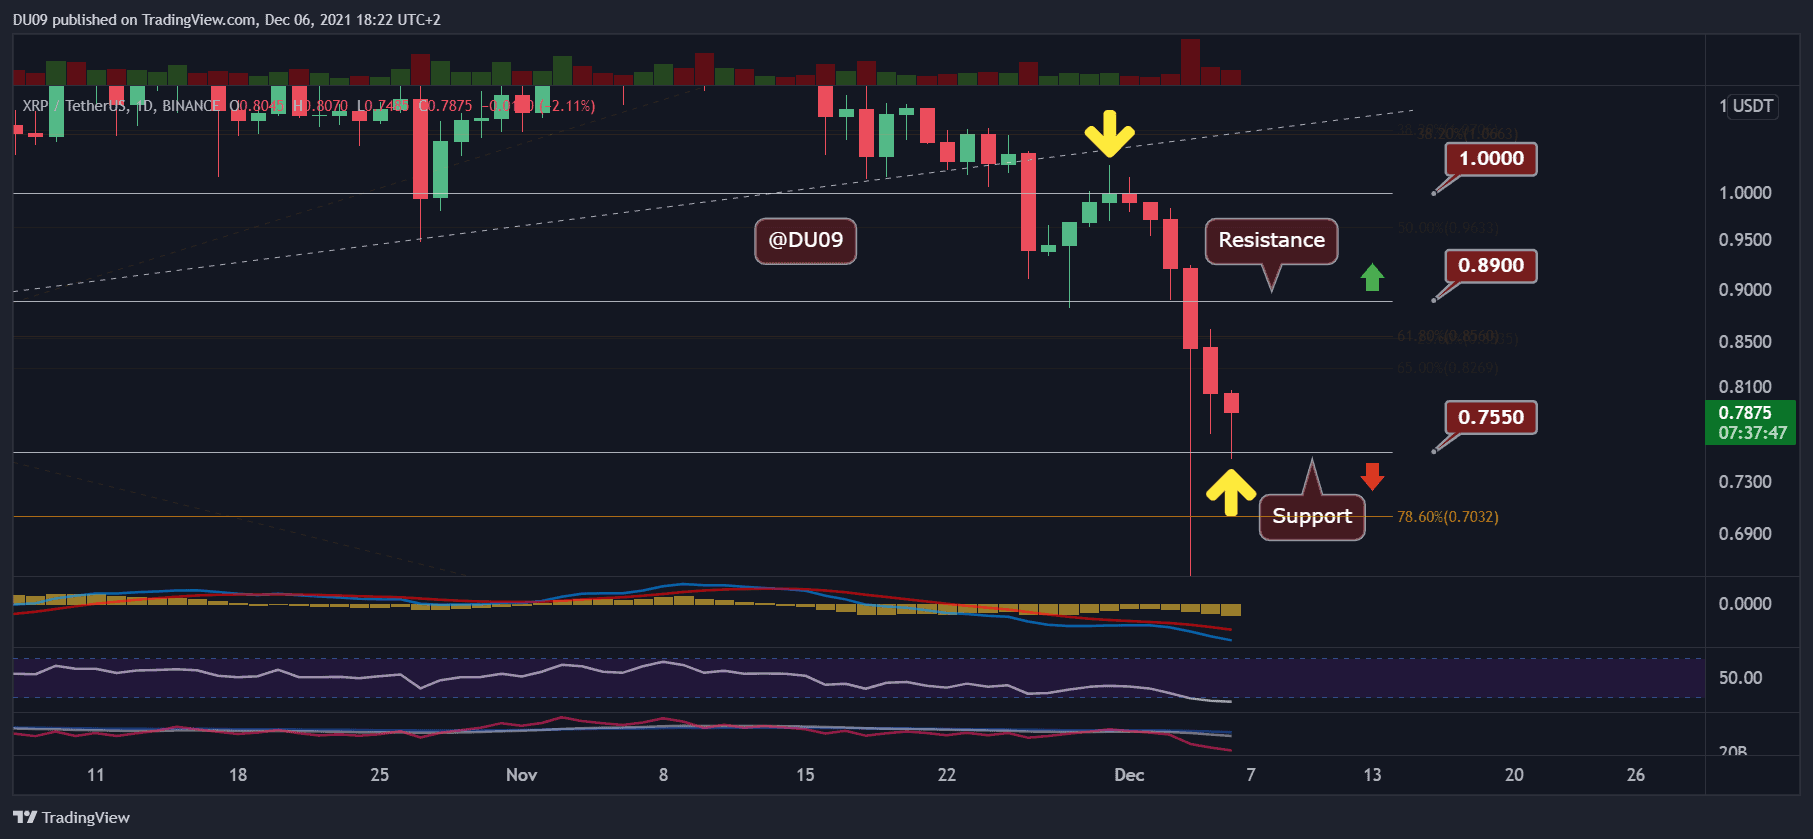
Trading Volume: The volume has decreased after Saturday’s crash. This is a bullish sign for a possible reversal.
RSI: The daily RSI is in oversold territory at 25 points. The last time the daily RSI was this low was in March 2020. For this reason, this downtrend may come to an end soon.
MACD: The MACD continues to be bearish, and both the histogram and moving averages made a lower low. It’s important to be patient as XRP needs more time to start a reversal, and probably a bullish divergence on the RSI and MACD histogram will be needed before this materializes.
Bias
The current XRP bias is bearish. The indicators remain negative, but there are some hints that this crash may come to an end.
Short-Term Prediction for XRP Price
The bulls suffered defeat after defeat this past week and were unable to stop XRP from falling below multiple support levels. However, the current support at $0.75 and $0.70 may stop this downtrend and give bulls hope for a reversal.