Key Support levels: .13; .06 Key Resistance level: .2; .4 As predicted in our last analysis, XRP rallied to .2 but was then quickly rejected by the bears and pushed lower to the support at .13. This shows that the bulls still do not have enough strength to sustain a rally. For now, the support level holds and may lead to another attempt from bulls to break above .2. If successful, this can push XRP higher towards .4. Chart by TradingViewTechnical Indicators Trading Volume: The rejection by the bears at the .2 resistance was sharp. However, the volume is currently fading. Therefore the bears are losing interest at these price levels, and bulls may take over once more. RSI: Despite the sharp rejection by the bears, the RSI managed to create a higher high on
Topics:
Duo Nine considers the following as important: Price Analysis, Ripple (XRP) Price, xrpbtc, xrpusd
This could be interesting, too:
Jordan Lyanchev writes Ripple’s (XRP) Surge to Triggers Over Million in Short Liquidations
Jordan Lyanchev writes Trump Confirms Work on Strategic Crypto Reserve: XRP, ADA, SOL Included
Dimitar Dzhondzhorov writes Is a Major Ripple v. SEC Lawsuit Development Expected This Week? Here’s Why
Mandy Williams writes Ripple Releases Institutional DeFi Roadmap for XRP Ledger in 2025
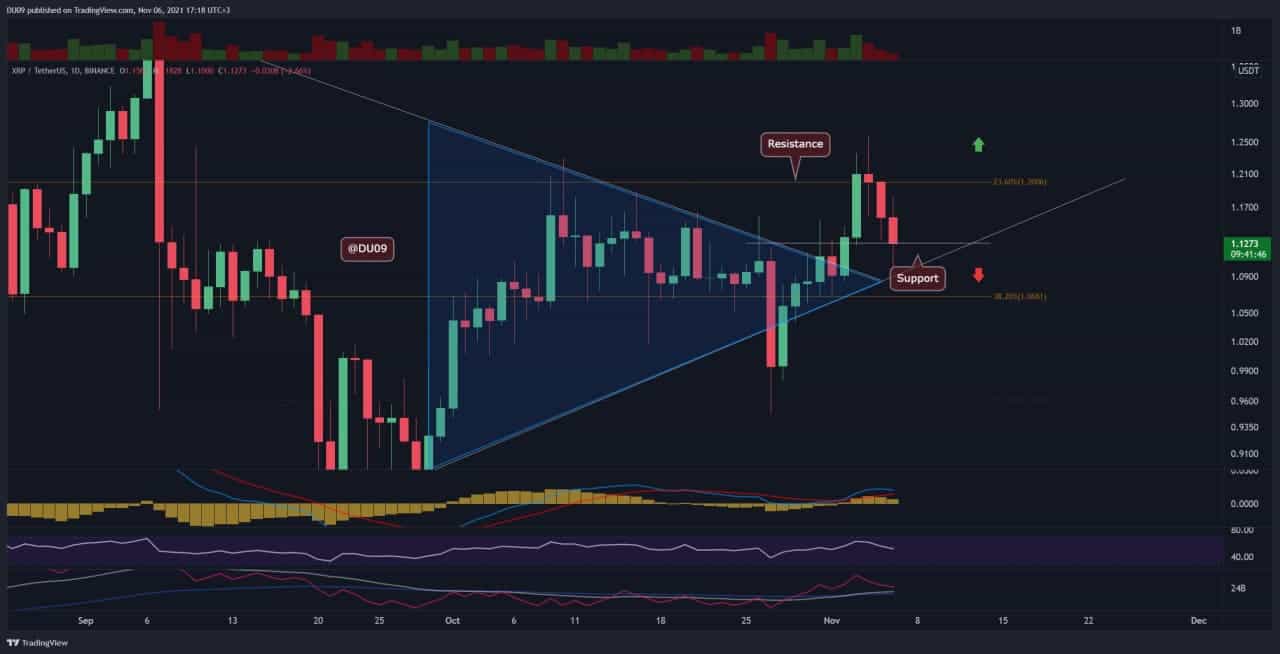
Key Support levels: $1.13; $1.06
Key Resistance level: $1.2; $1.4
As predicted in our last analysis, XRP rallied to $1.2 but was then quickly rejected by the bears and pushed lower to the support at $1.13. This shows that the bulls still do not have enough strength to sustain a rally. For now, the support level holds and may lead to another attempt from bulls to break above $1.2. If successful, this can push XRP higher towards $1.4.

Technical Indicators
Trading Volume: The rejection by the bears at the $1.2 resistance was sharp. However, the volume is currently fading. Therefore the bears are losing interest at these price levels, and bulls may take over once more.
RSI: Despite the sharp rejection by the bears, the RSI managed to create a higher high on the daily timeframe. This is bullish in the long term, and the current drop in the price may be a temporary pullback before bulls make a new attempt at breaking the key resistance.
MACD: On the daily timeframe, the MACD remains bullish, despite a falling histogram. A quick recovery from the bulls in the next few days can turn the tide back on the uptrend.
Bias
The bias remains bullish on XRP as long as it manages to hold the price above $1. The current correction can be interpreted as a short pullback before the price can continue its uptrend.
Short-Term Prediction for XRP Price
Despite the rejection, the bulls did manage to make a higher high on price and RSI. This is indicative that the larger trend is bullish. In this context, buyers may attempt another break at $1.2 before going for the next resistance at $1.4. Unless the bears step up their efforts, it’s likely that we will continue seeing XRP above $1 in the coming days.