Key Support level: ; %excerpt%.97 Key Resistance level: .2 In the last three days, the XRP price has been hovering just above . Any pullbacks were quickly defended by the bulls, who have so far managed to keep XRP above this important level. The XRP price action has been very quiet in the last few days, indicating that a break from the descending triangle (in blue) can be imminent. Usually, volatility always fades before a major break. Right now, the support at is holding well, and the resistance at .2 can be tested in case of a break above the pennant. Chart by TradingViewTechnical Indicators Trading Volume: The volume has been fading as we approached the end of the pennant. As soon as it breaks, volume should return in strength. RSI: In line with the price action,
Topics:
Duo Nine considers the following as important: Ripple (XRP) Price, XRP Analysis, xrpbtc, xrpusd
This could be interesting, too:
Jordan Lyanchev writes Ripple’s (XRP) Surge to Triggers Over Million in Short Liquidations
Jordan Lyanchev writes Trump Confirms Work on Strategic Crypto Reserve: XRP, ADA, SOL Included
Dimitar Dzhondzhorov writes Is a Major Ripple v. SEC Lawsuit Development Expected This Week? Here’s Why
Mandy Williams writes Ripple Releases Institutional DeFi Roadmap for XRP Ledger in 2025
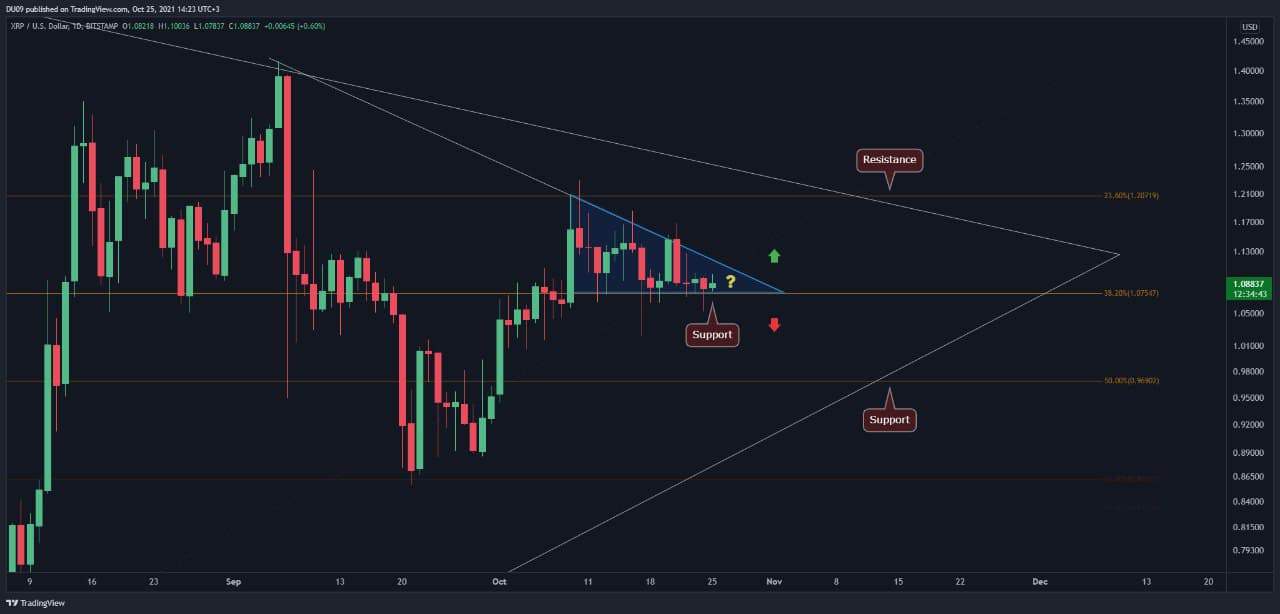
Key Support level: $1; $0.97
Key Resistance level: $1.2
In the last three days, the XRP price has been hovering just above $1. Any pullbacks were quickly defended by the bulls, who have so far managed to keep XRP above this important level.
The XRP price action has been very quiet in the last few days, indicating that a break from the descending triangle (in blue) can be imminent. Usually, volatility always fades before a major break. Right now, the support at $1 is holding well, and the resistance at $1.2 can be tested in case of a break above the pennant.
Technical Indicators
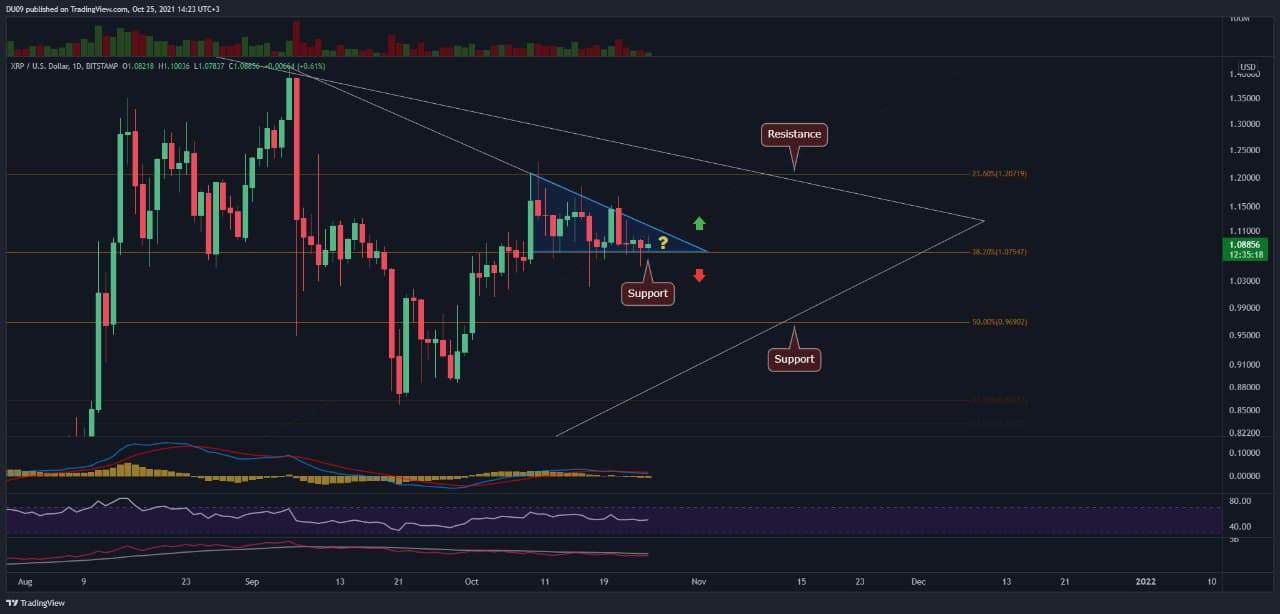
Trading Volume: The volume has been fading as we approached the end of the pennant. As soon as it breaks, volume should return in strength.
RSI: In line with the price action, the RSI has been making lower highs. This leans on the bearish side.
MACD: The moving averages on the daily time frame completed a bearish cross two days ago, indicating XRP could break below $1. The histogram is also on the negative side. However, without XRP breaking below the $1 support, it is too early to jump on the bearish side.
Bias
Neutral. XRP price can go either way, and a break of the current pennant can happen at any time. While the MACD gives a bearish signal, it is too early to change bias until we have a clean break of the pennant. The volatility has been decreasing in anticipation of a breakout.
Short-Term Prediction for XRP Price
Until XRP breaks away from the blue pennant, the price will stay close to $1, particularly as we are approaching the apex of the formation. Volatility can continue to decrease with minimal price movements. This can change as soon volume returns, and the price makes an attempt to break away from the $1 support.