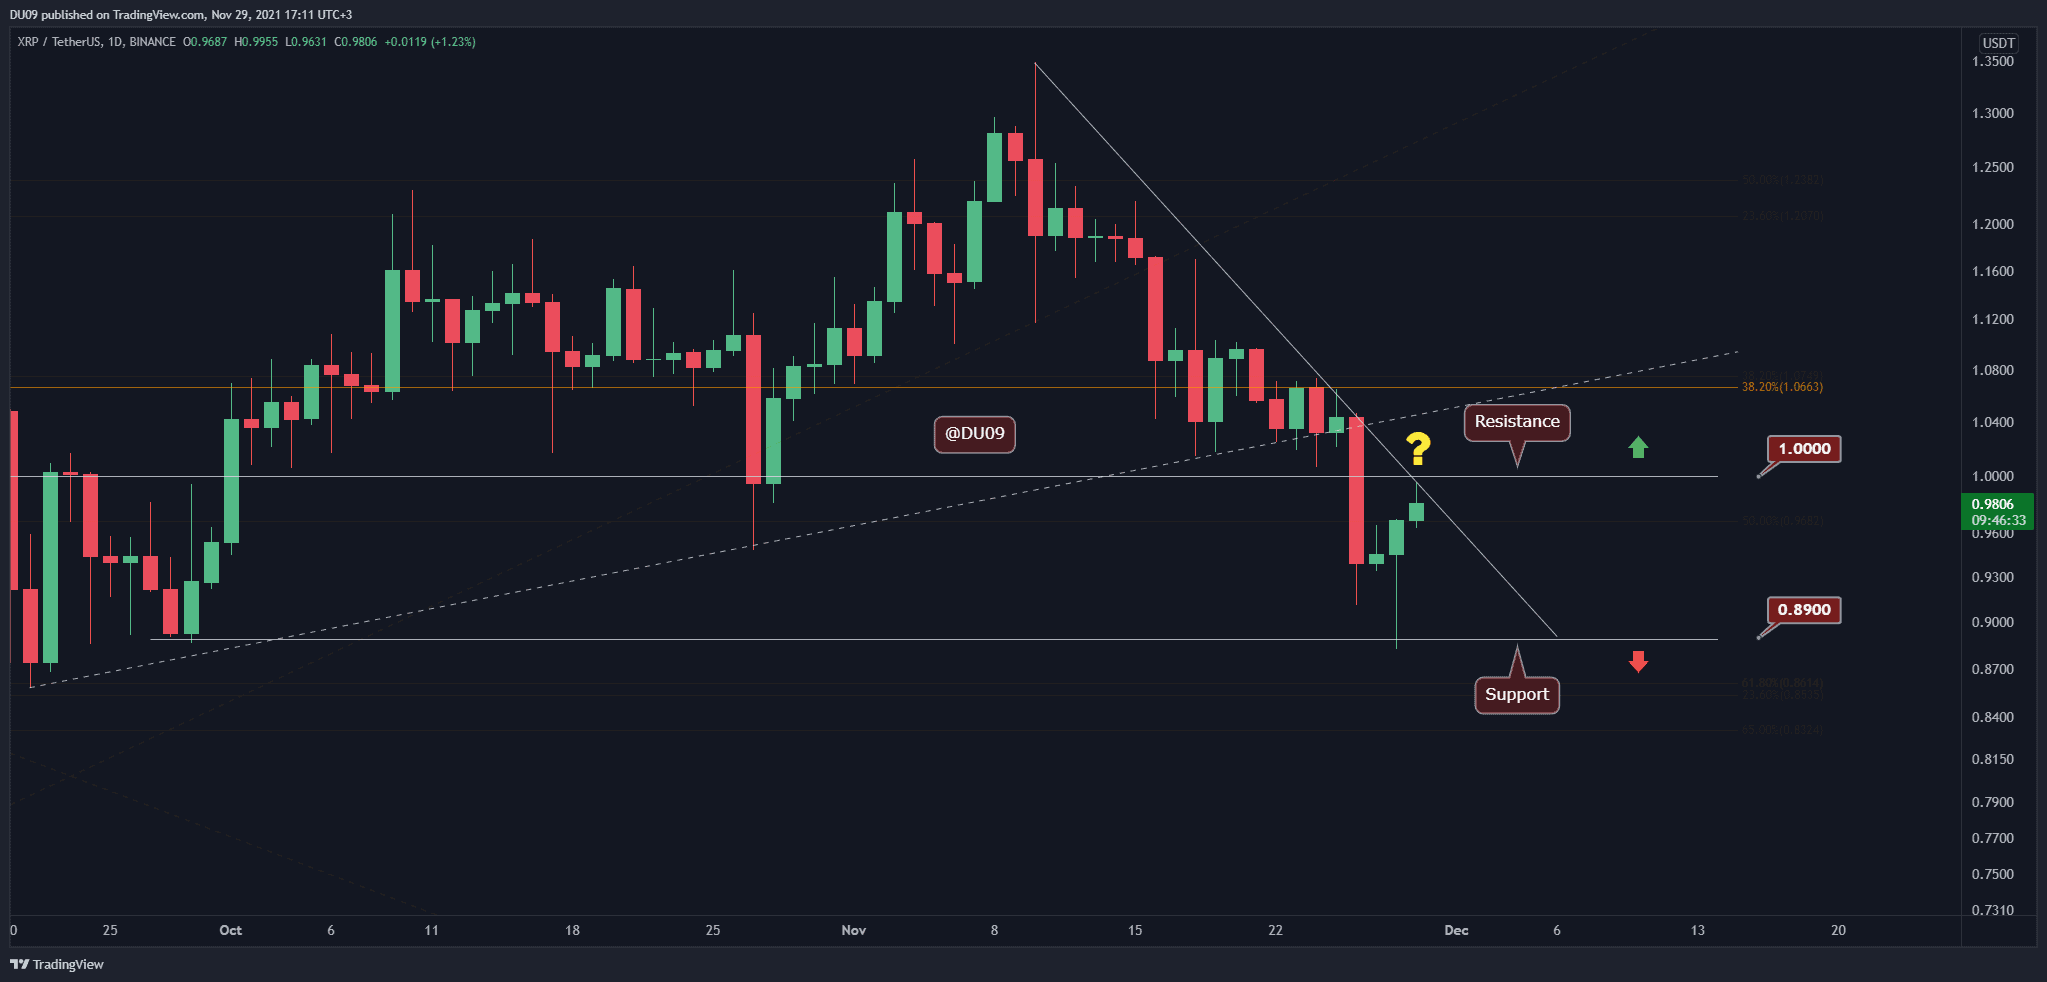
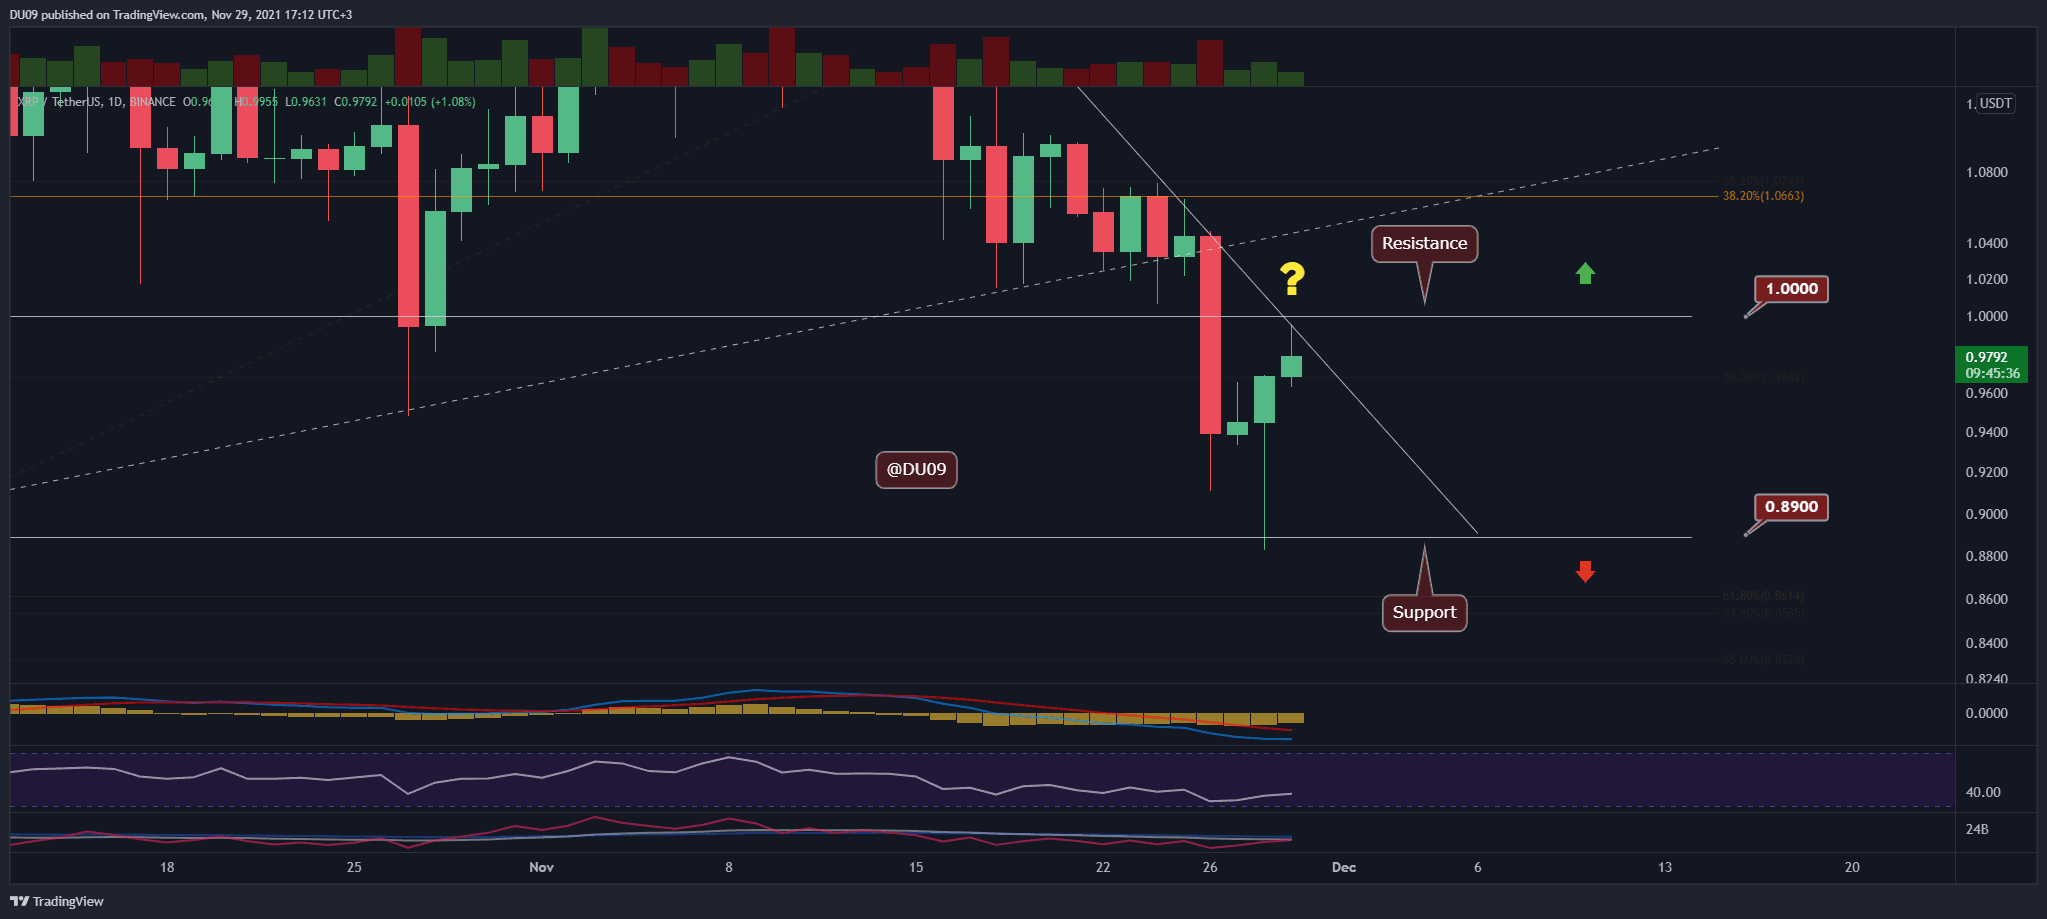
Key Support levels: %excerpt%.89 Key Resistance level: On 26 November, XRP broke below – following our analysis at the time that anticipated a significant move. With this breakdown, bulls lost a key support level as the level turned into resistance. The drop in price found good support at %excerpt%.89, and XRP is currently attempting a recovery back to . It’s interesting to see if the cryptocurrency will recover above this level on its first attempt, as it seems likely that volatility might be inbound. Chart by TradingViewTechnical Indicators Trading Volume: The volume during the breakdown under was considerable. Since then, the bulls were timid to push prices higher, and the volume remains low. RSI: The daily RSI made a lower low and is trying to curve back up. During the
Topics:
Duo Nine considers the following as important: Price Analysis, Ripple (XRP) Price, XRP Analysis
This could be interesting, too:
Mandy Williams writes Ripple Releases Institutional DeFi Roadmap for XRP Ledger in 2025
Jordan Lyanchev writes ChatGPT and DeepSeek Analyze Ripple’s (XRP) Price Potential for 2025
CryptoVizArt writes XRP Breakout Imminent? Ripple Price Analysis Suggests a Decisive Move
Dimitar Dzhondzhorov writes 6 Reasons Why This Finance Expert Dumped His Ripple (XRP) Holdings
Key Support levels: $0.89
Key Resistance level: $1
On 26 November, XRP broke below $1 – following our analysis at the time that anticipated a significant move. With this breakdown, bulls lost a key support level as the $1 level turned into resistance.
The drop in price found good support at $0.89, and XRP is currently attempting a recovery back to $1. It’s interesting to see if the cryptocurrency will recover above this level on its first attempt, as it seems likely that volatility might be inbound.
Technical Indicators
Trading Volume: The volume during the breakdown under $1 was considerable. Since then, the bulls were timid to push prices higher, and the volume remains low.
RSI: The daily RSI made a lower low and is trying to curve back up. During the 26 November drop, the RSI stopped just above the oversold zone at 33 points. Be on guard as the bears may attempt another push lower in the future.
MACD: The MACD continues to be bearish, and the histogram made a lower low on the daily timeframe. This is not good news for bulls. Unless they manage to push and keep the price above $1, it is unlikely the downtrend will end anytime soon.
Bias
The current XRP bias is bearish. As shown by the indicators, the bulls lack the strength to reverse the current downtrend and may need more time for that to happen. Things can brighten up if they manage to get XRP back above $1.
Short-Term Prediction for XRP Price
The bulls suffered a major loss when they could not defend the $1 level. Since then, the attempts to return XRP price to this key level were met with low volume and lack of interest.