Key Support levels: 0 Key Resistance level: 3, 6 SOL has corrected around 30% from its all-time high at 9 and has found good support at the 0 level. While the latest drop in price made a lower low on the chart, the RSI has made a higher low. This is a bullish divergence and may indicate that the correction is coming to an end soon. To confirm this, SOL’s price has to pass two key resistance levels found at 3 and 6. Chart by TradingView.Technical Indicators Trading Volume: The volume decreased as the correction progressed. This is a bullish sign. It’s important to watch closely the volume once SOL tries to rally. If it has a sharp increase, that would show bulls are eager to get back into the action. RSI: The daily RSI made a higher low despite the
Topics:
Duo Nine considers the following as important: Price Analysis, Solana (SOL) Price, SOLBTC, SOLUSD
This could be interesting, too:
Jordan Lyanchev writes Trump Confirms Work on Strategic Crypto Reserve: XRP, ADA, SOL Included
Chayanika Deka writes Bitcoin Ends Week with 5M Inflows as Multi-Asset Products Face 1M in Losses
Wayne Jones writes Solana Surpasses Ethereum as Top Ecosystem for New Developers in 2024: Report
Jordan Lyanchev writes Solana Whales Begin Accumulation Spree Amid Predictions of SOL at 0
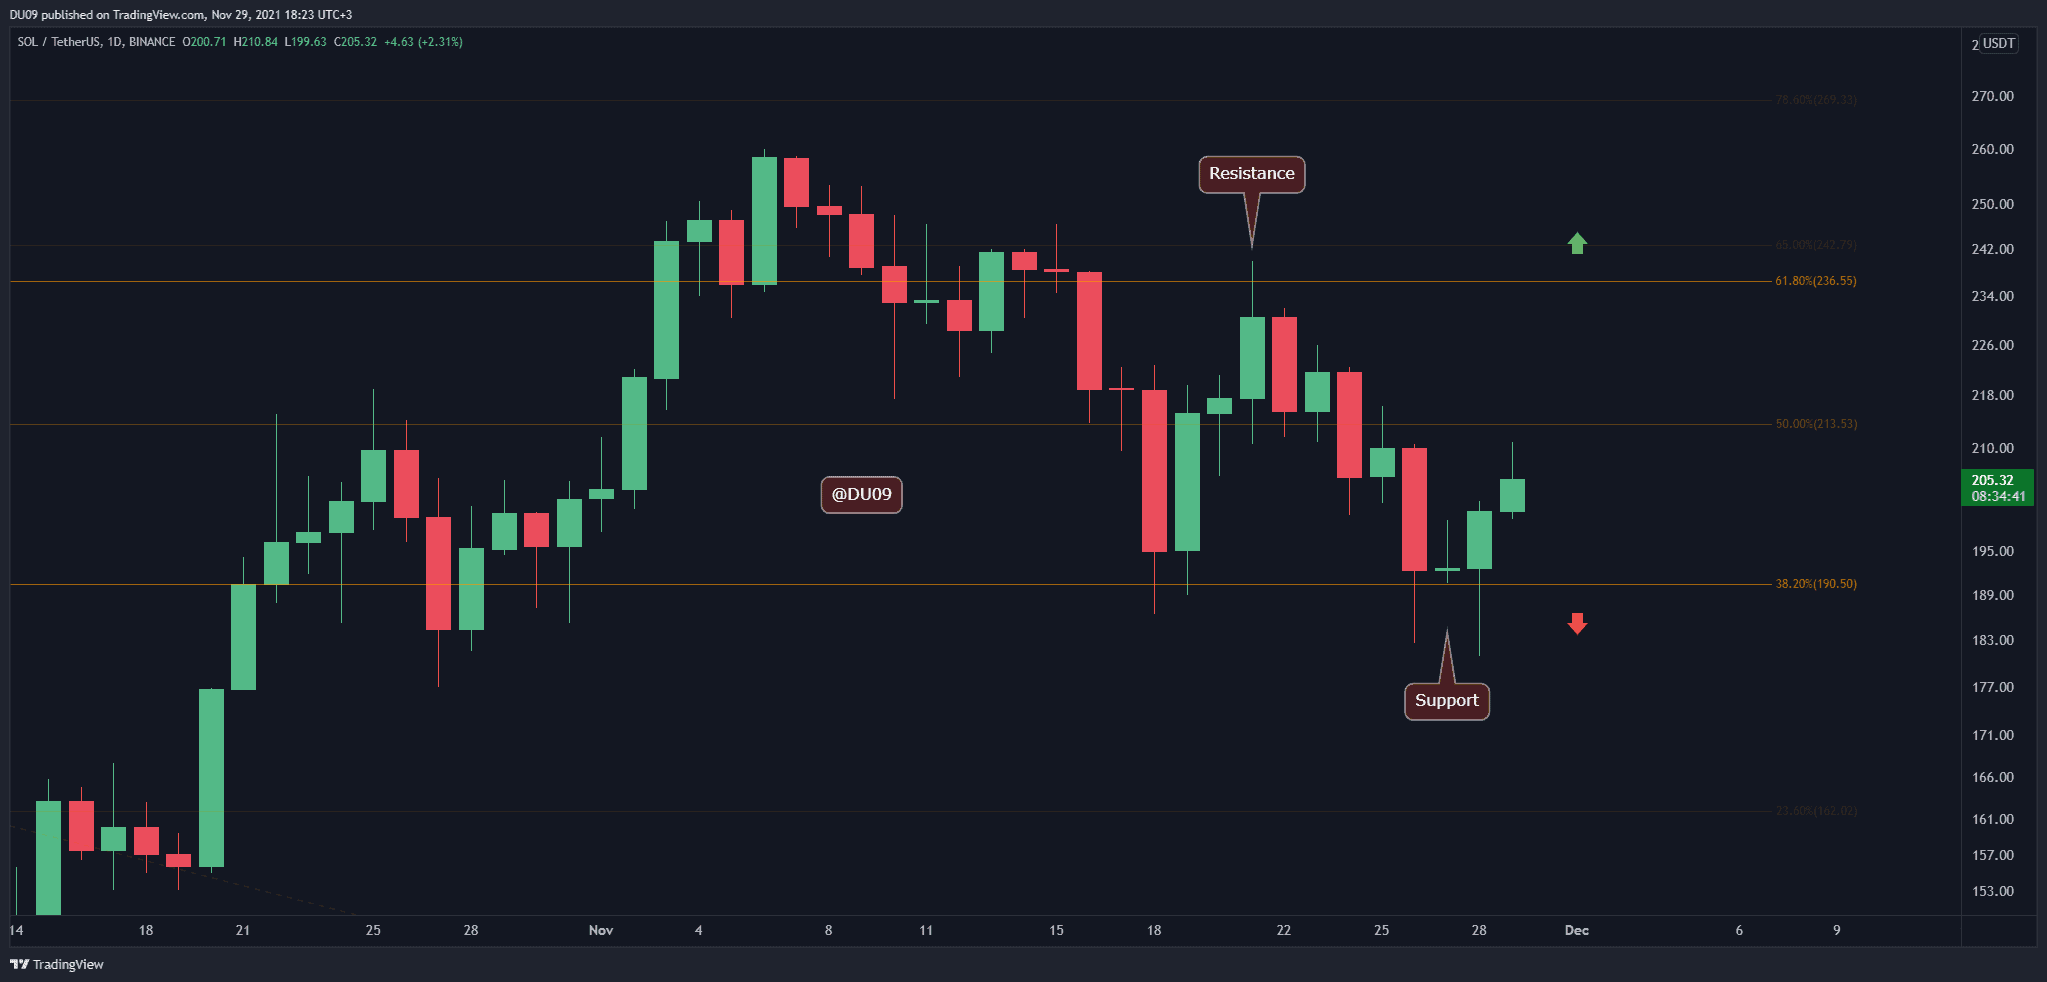
Key Support levels: $190
Key Resistance level: $213, $236
SOL has corrected around 30% from its all-time high at $259 and has found good support at the $190 level. While the latest drop in price made a lower low on the chart, the RSI has made a higher low. This is a bullish divergence and may indicate that the correction is coming to an end soon. To confirm this, SOL’s price has to pass two key resistance levels found at $213 and $236.
Technical Indicators
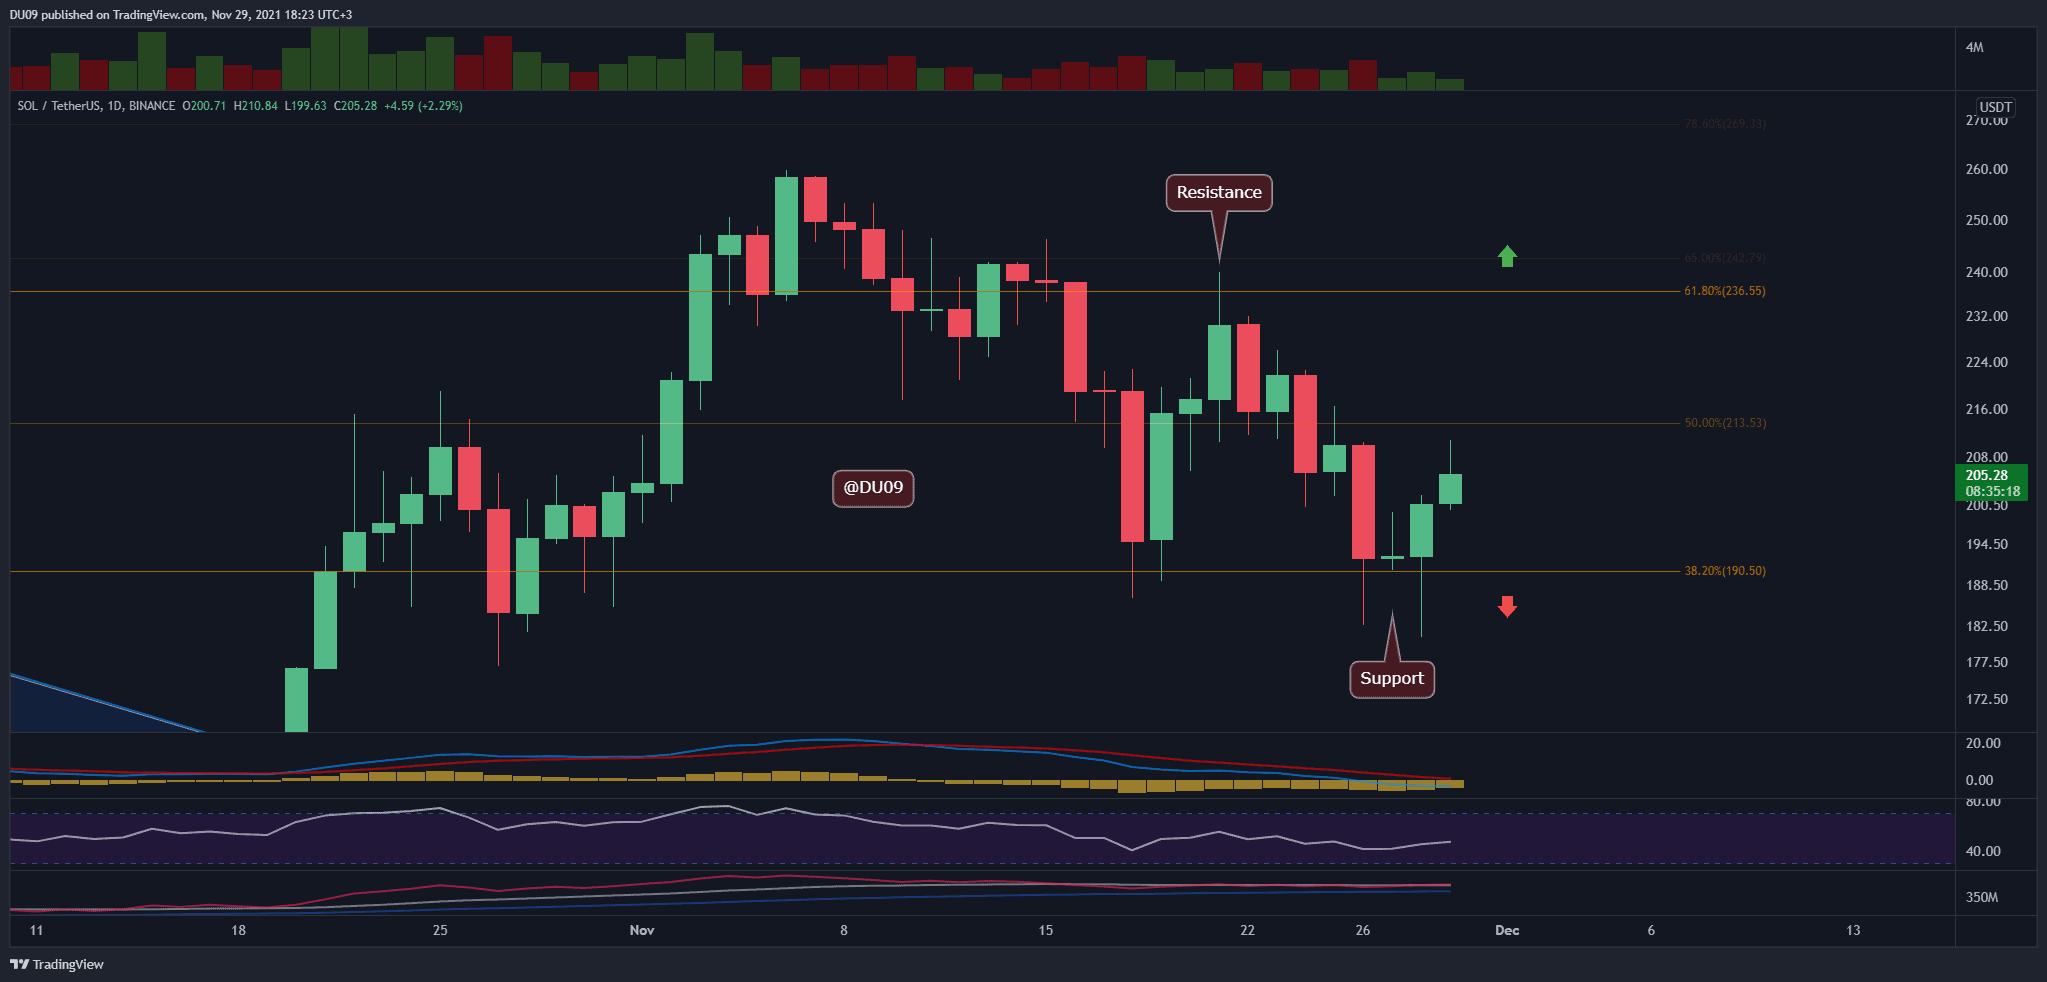
Trading Volume: The volume decreased as the correction progressed. This is a bullish sign. It’s important to watch closely the volume once SOL tries to rally. If it has a sharp increase, that would show bulls are eager to get back into the action.
RSI: The daily RSI made a higher low despite the price falling. This is a bullish divergence and a sign of strength for bulls. If confirmed, this can be followed by a strong rally.
MACD: MACD remains bearish on the daily timeframe, but the histogram also made a higher low, similar to the RSI. This is also bullish. However, confirmation will only come when there is a cross to the positive side. SOL appears to need more time for that to materialize.
Bias
The bias is neutral despite the bullish divergence. It is too early to act upon this divergence, and SOL’s price may need a bit more time to decide on the next steps. A break above $213 would be a good start towards a new rally.
Short-Term Prediction for SOL Price
The price has to break the first resistance at $213 before SOL can rally higher. Until then, the consolidation can continue as bulls gather their forces. So long as the price does not fall under the key support at $190, SOL has a good chance to recover most of the recent losses.