Key Support level: %excerpt%.000030; %excerpt%.000034 Key Resistance level: : %excerpt%.000038; %excerpt%.000047 SHIB has managed to exit the downtrend, and the price is currently moving sideways. The resistance at %excerpt%.000038 has so far stopped SHIB from going higher. The current support is found at %excerpt%.000034, and SHIB could continue moving sideways until a breakout takes place. Chart by TradingViewTechnical Indicators Trading Volume: The volume has increased ever since SHIB bounced off the %excerpt%.000030 support level. Interest in SHIB is growing, which is positive news for bulls. RSI: The RSI on the daily failed to make a higher high on this last rally, but as of yet, it’s hard to categorize this as a bearish development. MACD: The daily MACD remains bullish, but the histogram lost some of the momentum
Topics:
Duo Nine considers the following as important: Price Analysis, Shiba Inu (SHIB), SHIBBTC, SHIBUSD
This could be interesting, too:
Jordan Lyanchev writes Meme Coin Bloodbath: BONK, FLOKI, WIF, SHIB, and DOGE Crash by Double Digits
Dimitar Dzhondzhorov writes Shiba Inu’s Shibarium Reaches a New Milestone: Details
George Georgiev writes Important Shiba Inu (SHIB) Announcement
Jordan Lyanchev writes Here’s Why Shiba Inu’s (SHIB) 10% Daily Correction Could be Good News: Analysts
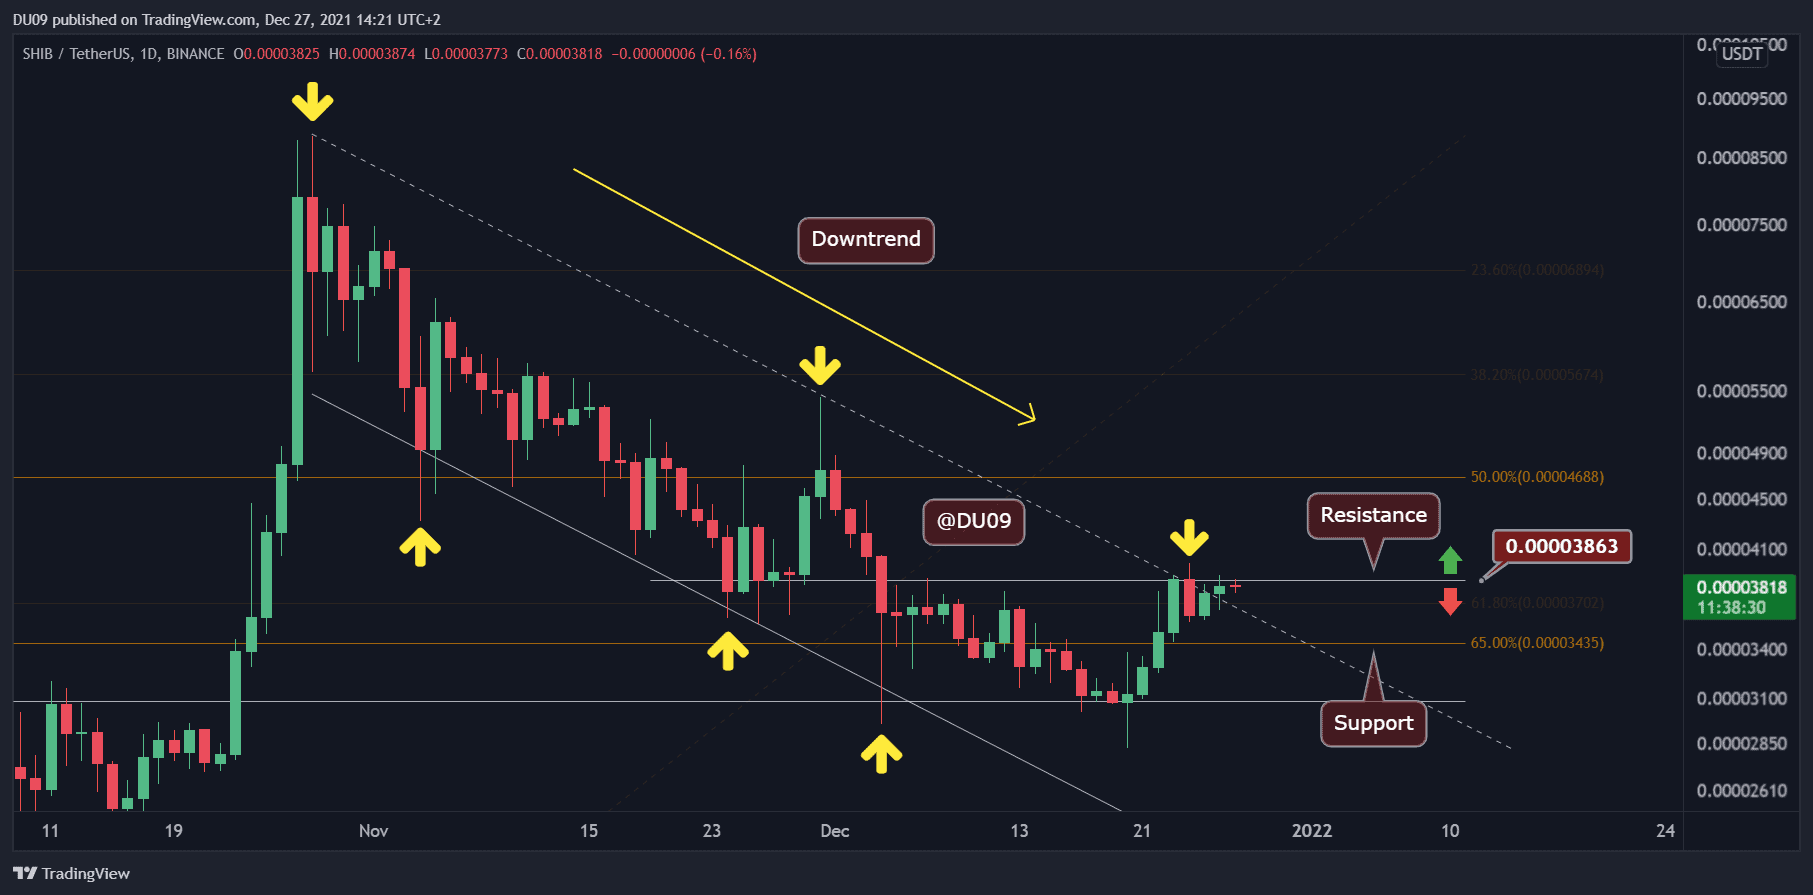
Key Support level: $0.000030; $0.000034
Key Resistance level: : $0.000038; $0.000047
SHIB has managed to exit the downtrend, and the price is currently moving sideways. The resistance at $0.000038 has so far stopped SHIB from going higher. The current support is found at $0.000034, and SHIB could continue moving sideways until a breakout takes place.
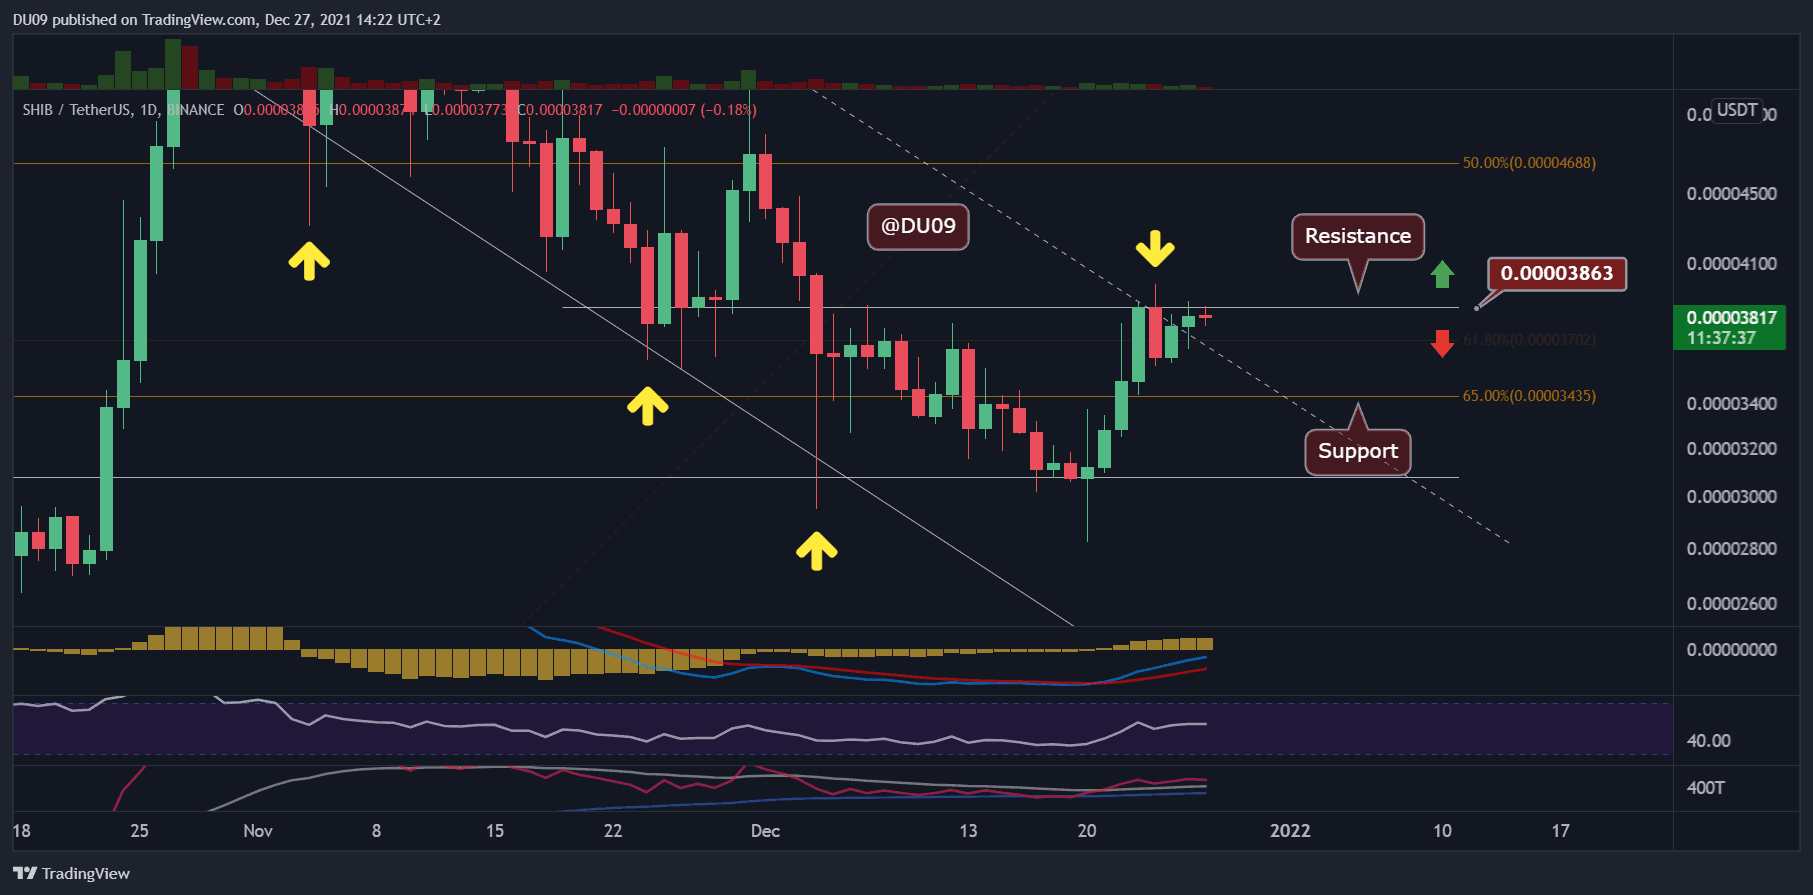
Technical Indicators
Trading Volume: The volume has increased ever since SHIB bounced off the $0.000030 support level. Interest in SHIB is growing, which is positive news for bulls.
RSI: The RSI on the daily failed to make a higher high on this last rally, but as of yet, it’s hard to categorize this as a bearish development.
MACD: The daily MACD remains bullish, but the histogram lost some of the momentum in the past few days. This is to be expected as SHIB is consolidating under resistance. If momentum fades more, then the cryptocurrency could retest the key support again.
Bias
The bias on SHIB is bullish. Even if there is a pullback, that would likely be a healthy move before it explores higher levels.
Short-Term Prediction for SHIB Price
If SHIB is successful in breaking above the current resistance at $0.000038, then the price can rally to $0.000047, which is the next key level to watch for. If that fails, then a pullback becomes very likely to the key support at $0.000034 before another attempt is made to move higher.