Key Support level: %excerpt%.000055 Key Resistance level: %excerpt%.000063 SHIB recovered most of the losses from this past week with a 50% rally yesterday in a considerable price swing. However, the big question is if SHIB made a lower high. At the time of this post, SHIB is still trying to move above the key resistance at %excerpt%.000063. A failure to close above it would confirm the lower high, and that would likely lead to bears taking control of the price again. The price is currently holding well above the %excerpt%.000055 support level, but another break below that would encourage bears to push SHIB lower. Chart by TradingViewTechnical Indicators of SHIB Price Trading Volume: Strong volume brought SHIB back into the blue triangle, and now the fight is to maintain price inside it and attempt
Topics:
Duo Nine considers the following as important: Price Analysis, Shiba Inu (SHIB), SHIBBTC, SHIBUSD
This could be interesting, too:
Dimitar Dzhondzhorov writes Watch Out: Shiba Inu (SHIB) Team Issues a Major Warning to the Community
Dimitar Dzhondzhorov writes Shiba Inu (SHIB) Might Plunge by Another 30% Before Finding Support (Analyst)
Jordan Lyanchev writes Shiba Inu Price Forecasts: Another 50% Crash or 420% Rally Ahead for SHIB?
Dimitar Dzhondzhorov writes This Trader Made Over Million by Selling Shiba Inu (SHIB) Holdings: Details
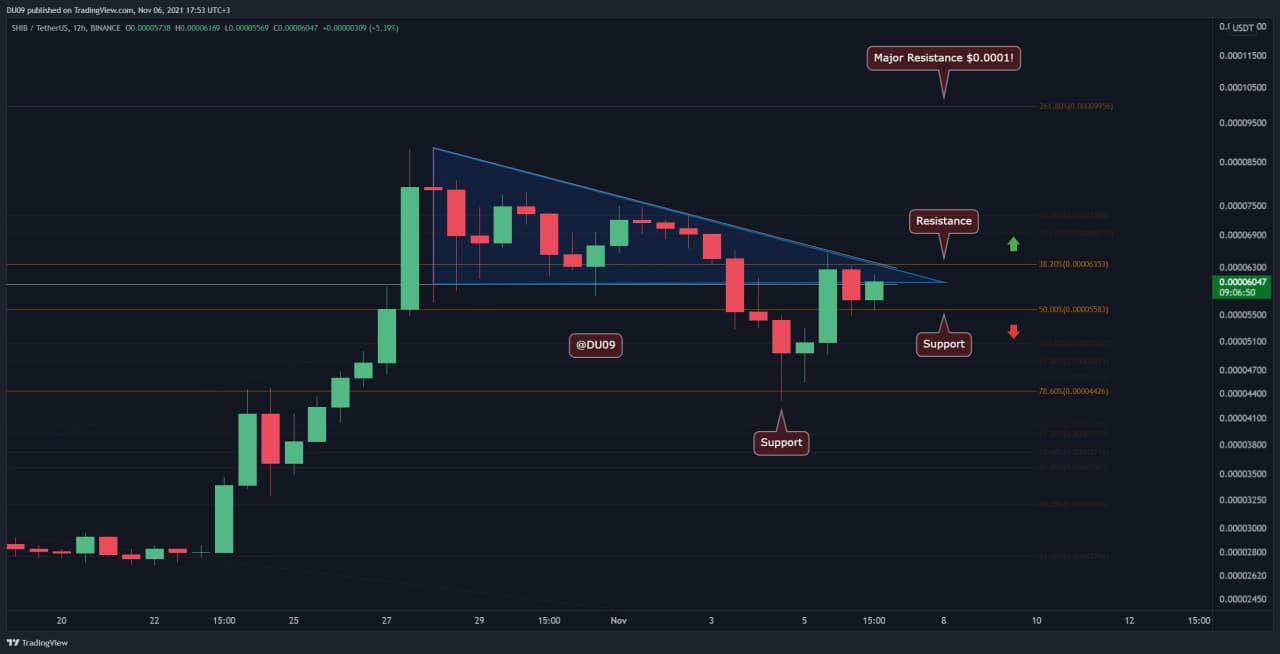
Key Support level: $0.000055
Key Resistance level: $0.000063
SHIB recovered most of the losses from this past week with a 50% rally yesterday in a considerable price swing. However, the big question is if SHIB made a lower high. At the time of this post, SHIB is still trying to move above the key resistance at $0.000063. A failure to close above it would confirm the lower high, and that would likely lead to bears taking control of the price again.
The price is currently holding well above the $0.000055 support level, but another break below that would encourage bears to push SHIB lower.
Technical Indicators of SHIB Price
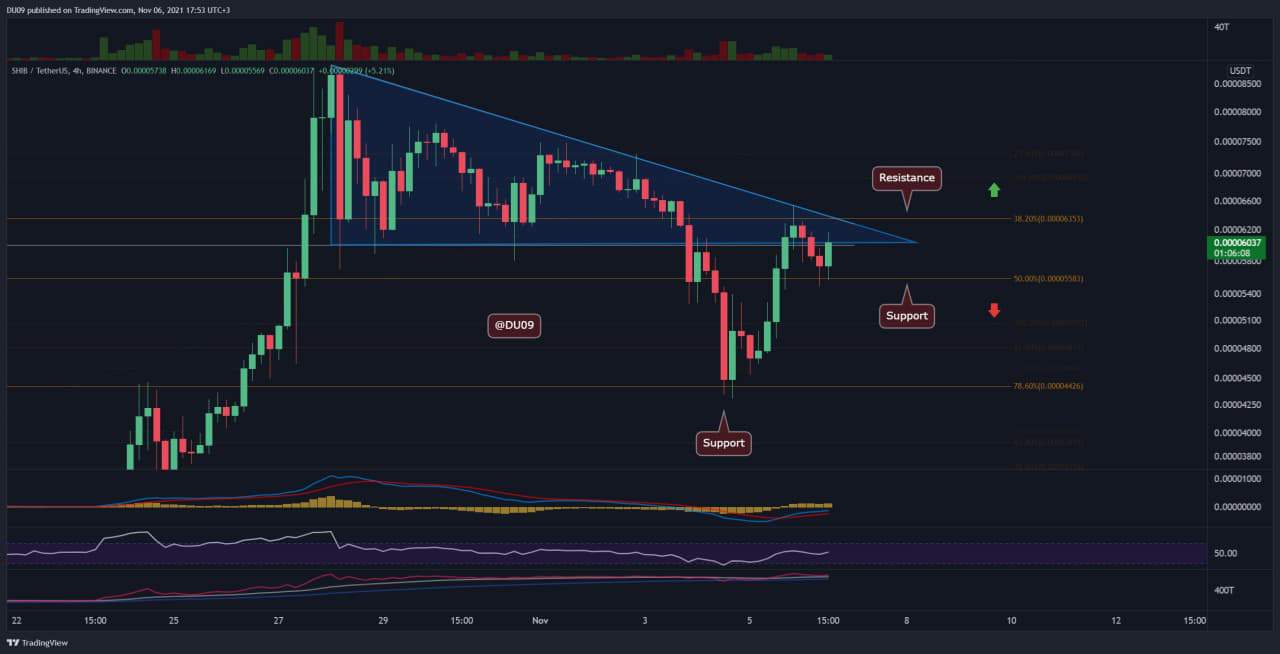
Trading Volume: Strong volume brought SHIB back into the blue triangle, and now the fight is to maintain price inside it and attempt a breakout.
RSI: After dropping below 30 points on the 4-hour timeframe, the RSI recovered quickly and is currently pushing higher. However, on the daily timeframe, the RSI is making lower highs. This is a significant warning for bulls that they need to step up, otherwise bears may return in force.
MACD: The MACD on the daily timeframe remains bearish. This last rally gives hope to SHIB holders, but the bulls have to continue to push the price higher. Otherwise, any sign of weakness will be immediately exploited by the bears.
Bias
The bias is Bat this time. A failure from the bulls to push above the key resistance and the bears might take back control of price. For now, the price is expected to bounce between the key levels indicated at the start of this analysis. A break of either would change the bias towards the winning side.
Short-Term Prediction for SHIB Price
The battle between the bulls and bears at the current price level will decide the fate of SHIB for the remaining month. This is a decisive moment for SHIB, and until there is a winner, it’s expected to see SHIB’s price hover between support and resistance.