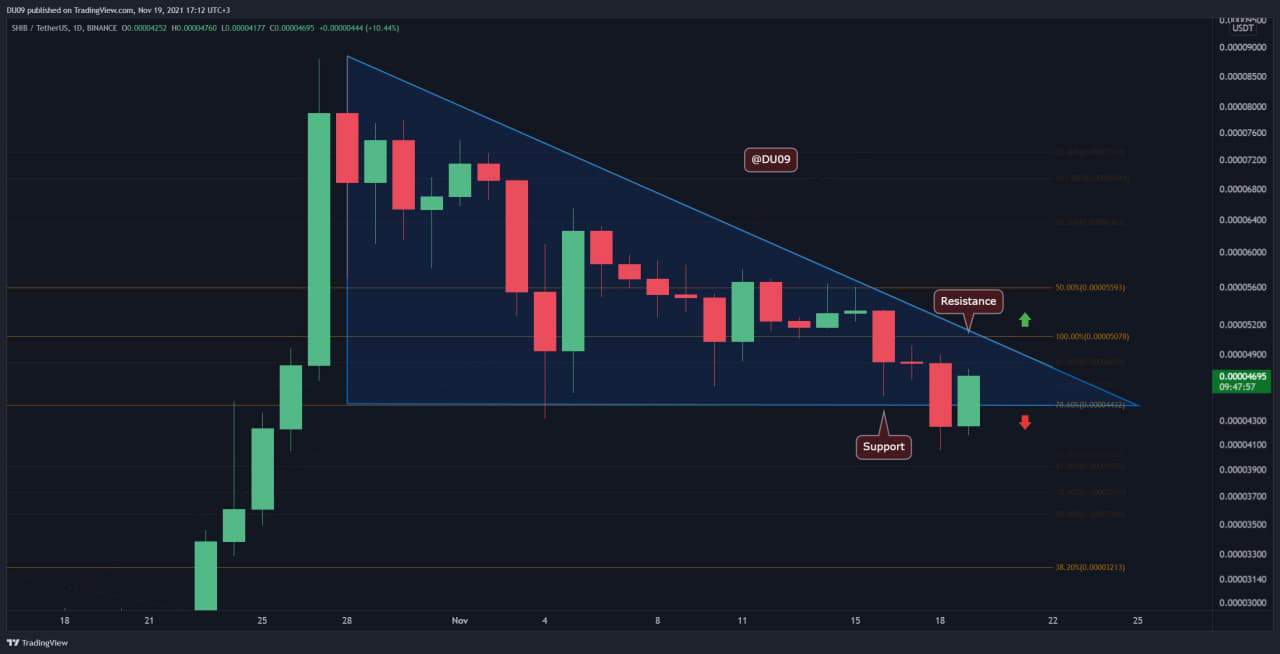
Key Support level: %excerpt%.000044; %excerpt%.000032 Key Resistance level: : %excerpt%.000050; %excerpt%.000055 SHIB’s price was in a very dangerous area yesterday when it broke below the support level at %excerpt%.000044. There was panic and despair in the market, with most SHIB holders starting to doubt their investment. Fortunately, the bulls reversed the downtrend today and got the price back into the blue triangle, which gives temporary relief, at least. However, the bears managed to push SHIB lower, and the daily chart has made a lower low. Together with the lower highs, SHIB has been making in the past month, the chart paints a rather grim picture ahead. The trend is clearly bearish, at least for the time being. This makes the support at %excerpt%.000032 a likely target for bears before any potential
Topics:
Duo Nine considers the following as important: Price Analysis, Shiba Inu (SHIB), SHIBBTC, SHIBUSD
This could be interesting, too:
Dimitar Dzhondzhorov writes Watch Out: Shiba Inu (SHIB) Team Issues a Major Warning to the Community
Dimitar Dzhondzhorov writes Shiba Inu (SHIB) Might Plunge by Another 30% Before Finding Support (Analyst)
Jordan Lyanchev writes Shiba Inu Price Forecasts: Another 50% Crash or 420% Rally Ahead for SHIB?
Dimitar Dzhondzhorov writes This Trader Made Over Million by Selling Shiba Inu (SHIB) Holdings: Details
Key Support level: $0.000044; $0.000032
Key Resistance level: : $0.000050; $0.000055
SHIB’s price was in a very dangerous area yesterday when it broke below the support level at $0.000044. There was panic and despair in the market, with most SHIB holders starting to doubt their investment. Fortunately, the bulls reversed the downtrend today and got the price back into the blue triangle, which gives temporary relief, at least.
However, the bears managed to push SHIB lower, and the daily chart has made a lower low. Together with the lower highs, SHIB has been making in the past month, the chart paints a rather grim picture ahead. The trend is clearly bearish, at least for the time being. This makes the support at $0.000032 a likely target for bears before any potential reversal.
The only hope for bulls to avoid this scenario is to push SHIB’s price above the $0.000050 resistance.
Technical Indicators
Trading Volume: The volume remains low, but somehow the bulls cannot stop this downtrend decisively.
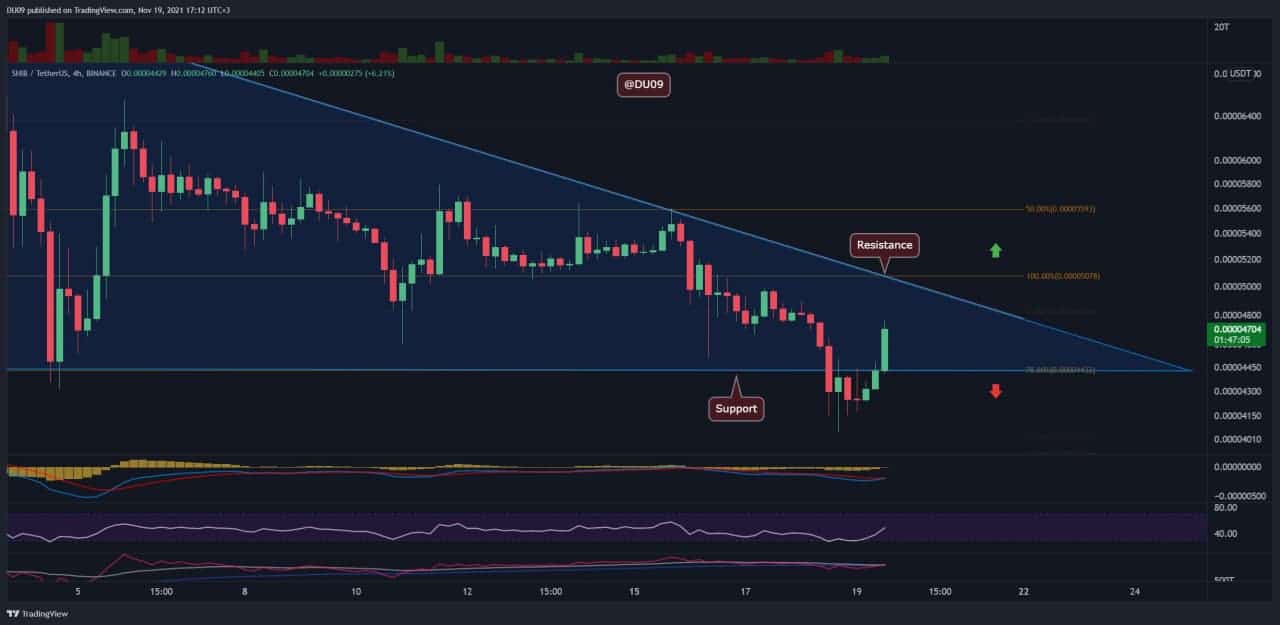
RSI: The RSI is curving up on the daily timeframe, and on 4-hour it touched the oversold area before jumping up today when the bulls came back.
MACD: The daily MACD remains bearish. The only positive aspect is that the histogram has stopped making lower lows. Perhaps this is the first indication that the bulls may regain control of price in the nearby future. However, it is too early to make a call on this now.
Bias
The bias on SHIB is bearish. Unless the price moves above the resistance at $0.000050 it is very hard to be bullish.
Short-Term Prediction for SHIB Price
The return of the price back into the blue triangle is a bullish signal, but it is not enough to change the bearish trend. Bulls need to step up and break the key resistance at $0.000050 if there is hope for a reversal. So long as that does not happen, SHIB can continue to decline.