Key Support level: %excerpt%.000030 Key Resistance level: : %excerpt%.000034 SHIB has finally arrived at the %excerpt%.000030 support level which has the best chance to reverse the current downtrend. This is because this level was the previous all-time high from October and should act as strong support. Moreover, the downtrend is forming an ending diagonal wave with converging lines based on Elliot Wave theory (see in blue). A break from this triangle can take the price to the resistance at %excerpt%.000034 and may start a significant rally. Chart by TradingViewTechnical Indicators Trading Volume: The volume has remained low during this correction. However, a reversal is likely to bring back buyers quickly looking at the past price action. RSI: The RSI is making higher lows on the 12-hours
Topics:
Duo Nine considers the following as important: Price Analysis, Shiba Inu (SHIB), SHIBBTC, SHIBUSD
This could be interesting, too:
Dimitar Dzhondzhorov writes Watch Out: Shiba Inu (SHIB) Team Issues a Major Warning to the Community
Dimitar Dzhondzhorov writes Shiba Inu (SHIB) Might Plunge by Another 30% Before Finding Support (Analyst)
Jordan Lyanchev writes Shiba Inu Price Forecasts: Another 50% Crash or 420% Rally Ahead for SHIB?
Dimitar Dzhondzhorov writes This Trader Made Over Million by Selling Shiba Inu (SHIB) Holdings: Details
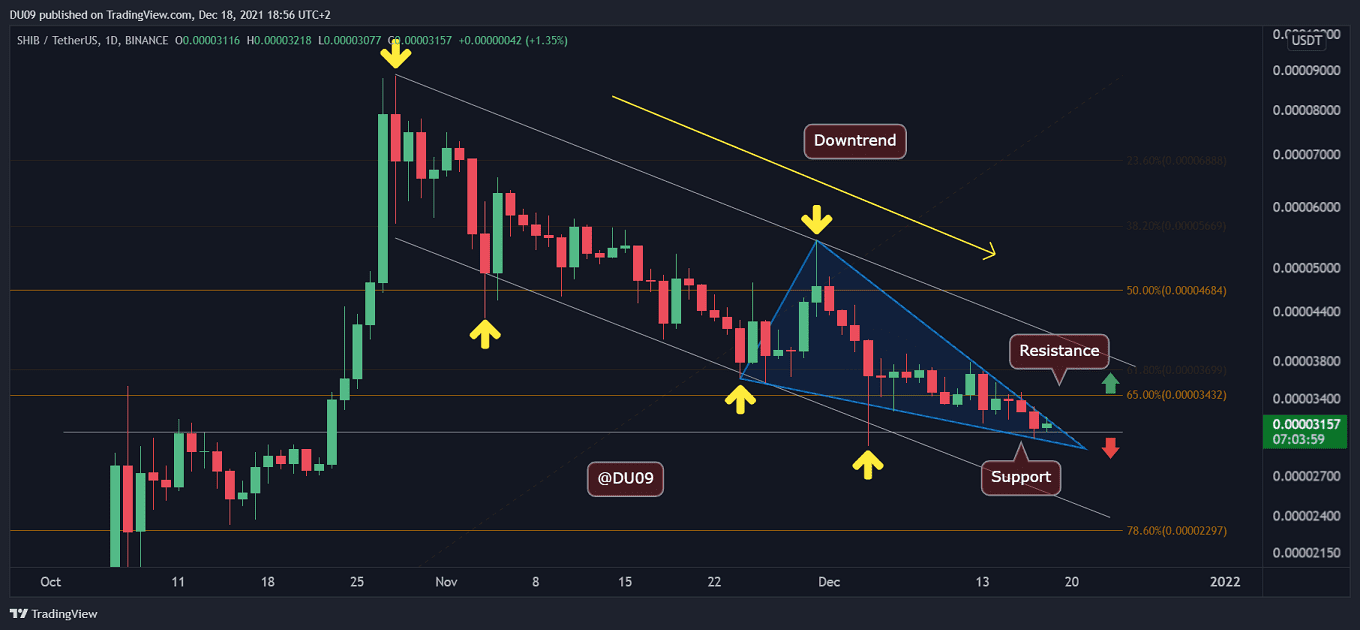
Key Support level: $0.000030
Key Resistance level: : $0.000034
SHIB has finally arrived at the $0.000030 support level which has the best chance to reverse the current downtrend. This is because this level was the previous all-time high from October and should act as strong support.
Moreover, the downtrend is forming an ending diagonal wave with converging lines based on Elliot Wave theory (see in blue). A break from this triangle can take the price to the resistance at $0.000034 and may start a significant rally.
Technical Indicators
Trading Volume: The volume has remained low during this correction. However, a reversal is likely to bring back buyers quickly looking at the past price action.
RSI: The RSI is making higher lows on the 12-hours timeframe. However, on the daily, this is not yet the case. This suggests SHIB may consolidate above the key support before attempting a rally.
MACD: The daily MACD has not yet made a bullish crossover. But this can take place at any moment should volatility return to SHIB as the MACD moving averages are very close to each other.

Bias
The bias on SHIB is neutral. A break above the key resistance can turn the bias bullish, while a break below will be bearish.
Short-Term Prediction for SHIB Price
SHIB’s correction has been ongoing for almost two full months and the price has dropped by over 60% since the all-time high at $0.000088. For this reason, it is likely that the downtrend may reverse soon and a relief rally could be expected.