Solana (SOL) rallied 30% and almost touched the all-time high levels of 6 after breaking out above a pennant formation. SOL missed the ATH price by just , according to Binance. Key Support level: 2, 7 Key Resistance level: 6 The mentioned above pennant is marked blue on the following chart. The current all-time high of 6 will continue to act as SOL’s next major resistance area. Since then, SOL has found support on the 2 level. If the price decides to correct further, then the next support level is located at 7. Considering the massive momentum of the recent rally, a consolidation is reasonable. Technical Indicators Trading Volume: Volume exploded as Solana broke above the blue pennant, leading to a rapid rally towards the all-time high resistance.
Topics:
Duo Nine considers the following as important: Price Analysis, Solana (SOL) Price, SOLBTC, SOLUSD
This could be interesting, too:
Jordan Lyanchev writes Trump Confirms Work on Strategic Crypto Reserve: XRP, ADA, SOL Included
Chayanika Deka writes Bitcoin Ends Week with 5M Inflows as Multi-Asset Products Face 1M in Losses
Wayne Jones writes Solana Surpasses Ethereum as Top Ecosystem for New Developers in 2024: Report
Jordan Lyanchev writes Solana Whales Begin Accumulation Spree Amid Predictions of SOL at 0
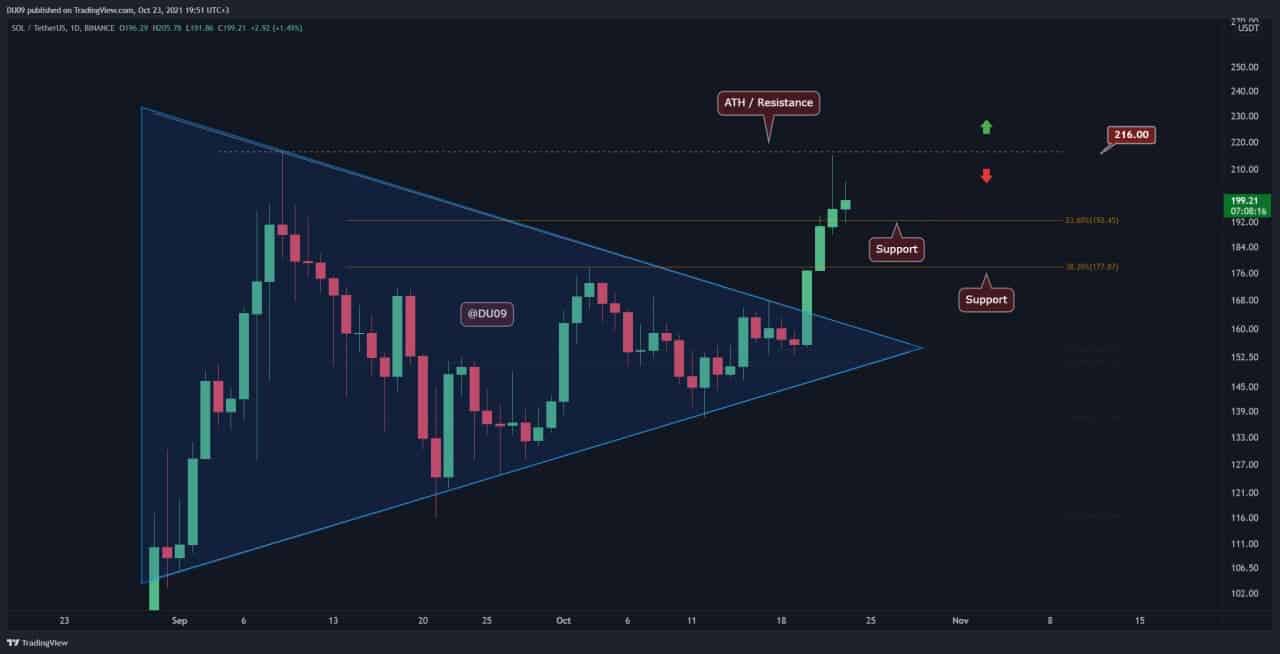
Solana (SOL) rallied 30% and almost touched the all-time high levels of $216 after breaking out above a pennant formation. SOL missed the ATH price by just $1, according to Binance.
Key Support level: $192, $177
Key Resistance level: $216
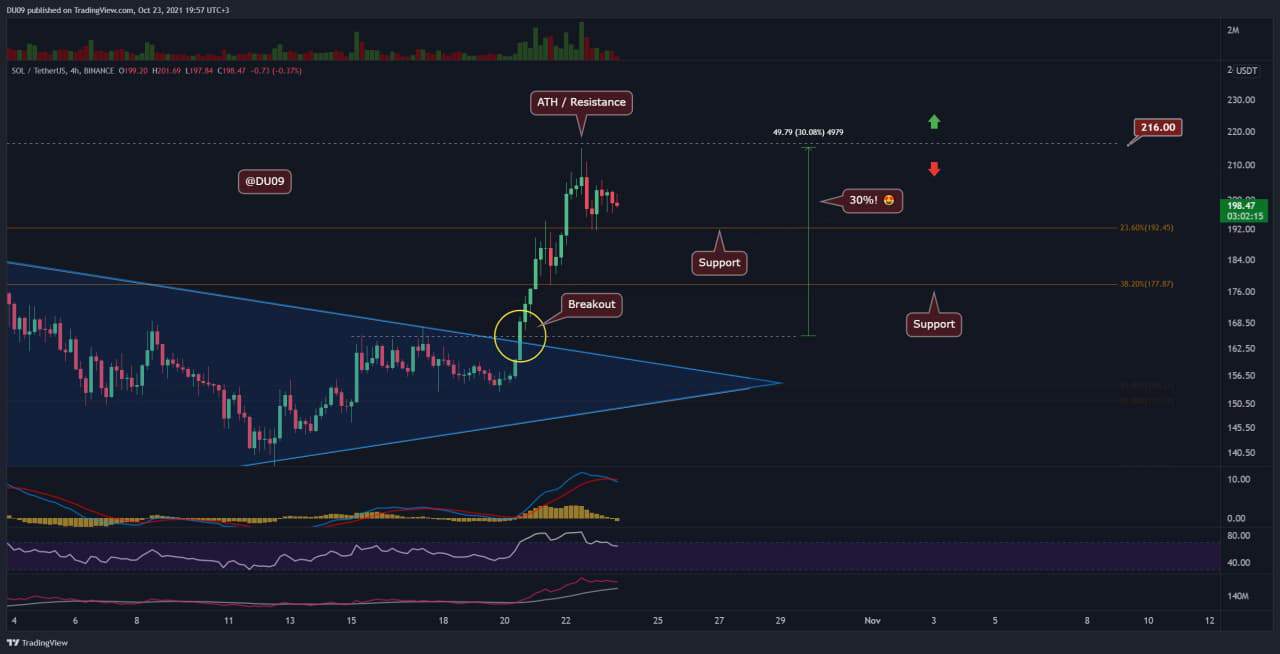
The mentioned above pennant is marked blue on the following chart. The current all-time high of $216 will continue to act as SOL’s next major resistance area. Since then, SOL has found support on the $192 level. If the price decides to correct further, then the next support level is located at $177. Considering the massive momentum of the recent rally, a consolidation is reasonable.
Technical Indicators
Trading Volume: Volume exploded as Solana broke above the blue pennant, leading to a rapid rally towards the all-time high resistance. Since then, the volume has decreased, supporting the idea of a consolidation period before the next move.
RSI: The RSI entered the overbought territory (>70) during the peak of the recent rally on the 4-hour timeframe. Since then, RSI dropped under 70 points during the ongoing correction from the past hours.
MACD: The MACD moving averages and histogram remain very bullish on the daily timeframe, while on the 4-hour timeframe, a minimal correction is underway. Price will look for a possible retest of the $192 support.
Bias
Bullish since price broke the blue pennant. As long as SOL’s price holds above $177, there is an excellent chance that Solana can see a second attempt to break the all-time high of $216. On the other hand, if the price loses $177, it will invalidate this bias.
Short-Term Price Prediction for SOL
In the near future, Solana is expected to see some consolidation around the $200 mark. Should the support at $192 fail, Solana can explore lower levels ($177) before any new attempt to break the all-time high occurs. Expect significant volatility from Solana over the short term.