SOL is heading towards the 0 key resistance level. A successful breakout, and retest as support, might likely lead the Solana native cryptocurrency for another shot for its next major resistance level around the ATH. Key Support levels: 7 Key Resistance level: 0, 5 SOL has found a solid horizontal support line amid the 7 level and is currently eyeing the 0 key resistance level. On the other hand, the SOL price had formed an ascending wedge which is a textbook bearish formation, so best to be cautious around current price levels as a short pullback becomes possible upon breaking down the wedge pattern. Chart by TradingViewTechnical Indicators Trading Volume: Sustained volume has continued to push SOL higher and there is no weakness yet. This is good news
Topics:
Duo Nine considers the following as important: Price Analysis, Solana (SOL) Price, SOLBTC, SOLUSD
This could be interesting, too:
Jordan Lyanchev writes Trump Confirms Work on Strategic Crypto Reserve: XRP, ADA, SOL Included
Chayanika Deka writes Bitcoin Ends Week with 5M Inflows as Multi-Asset Products Face 1M in Losses
Wayne Jones writes Solana Surpasses Ethereum as Top Ecosystem for New Developers in 2024: Report
Jordan Lyanchev writes Solana Whales Begin Accumulation Spree Amid Predictions of SOL at 0
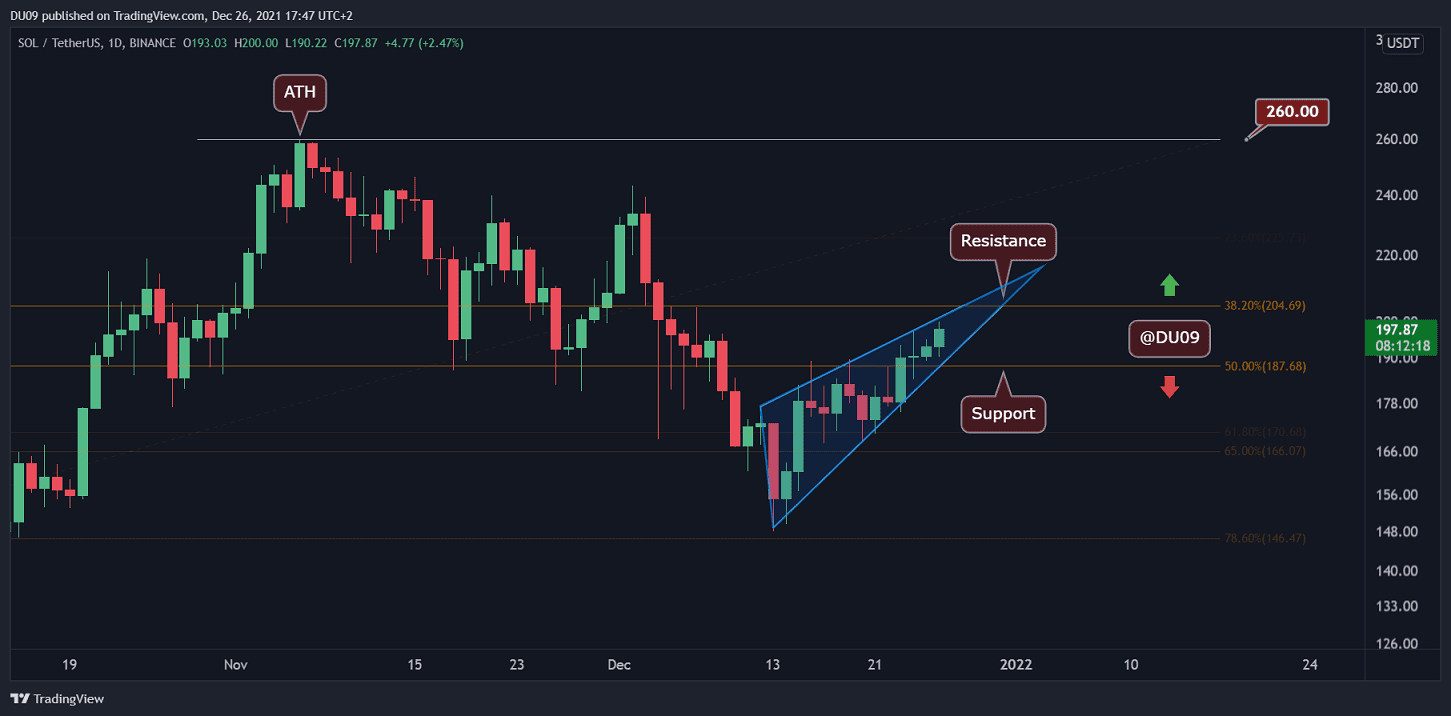
SOL is heading towards the $200 key resistance level. A successful breakout, and retest as support, might likely lead the Solana native cryptocurrency for another shot for its next major resistance level around the ATH.
Key Support levels: $187
Key Resistance level: $200, $205
SOL has found a solid horizontal support line amid the $187 level and is currently eyeing the $200 key resistance level.
On the other hand, the SOL price had formed an ascending wedge which is a textbook bearish formation, so best to be cautious around current price levels as a short pullback becomes possible upon breaking down the wedge pattern.
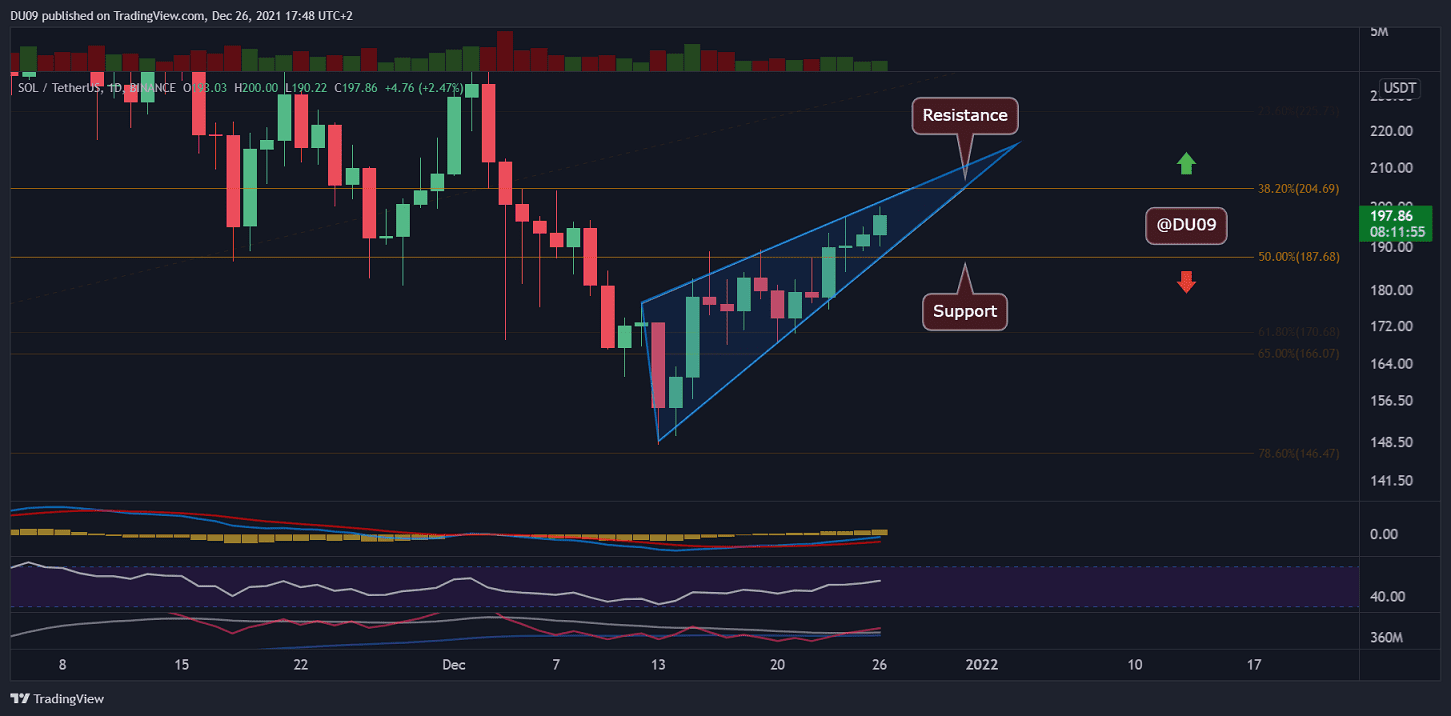
Technical Indicators
Trading Volume: Sustained volume has continued to push SOL higher and there is no weakness yet. This is good news for the bulls.
RSI: The RSI on the daily timeframe is marching upwards and recently crossed the 50 points mark. If it manages to reach over 58 points, this will signal a higher high which is is a clear bullish pattern.
MACD: The MACD on the daily timeframe is bullish with an expanding histogram and moving averages. This is exactly what one wants to witness in a bull trend.
Bias
The current bias is bullish but best to watch out for the current resistance level at $200 and the rising wedge bearish pattern.
Short-Term Prediction for SOL Price
SOL had seen great performance in the past week, moving across the resistance levels at a steady pace. The biggest challenge now is to break beyond $200 and create a solid base at this level. The bearish wedge requires caution as a pullback could take place before a further price increase.