Key Support levels: 7, 0 Key Resistance level: 4 SOL managed to find good support on the 7 level, which may provide some hope when it comes to halting the downtrend. The current resistance sits at 4, and it may take longer for SOL to attempt to breach above it. Ever since the cryptocurrency made the all-time high at 0, the price has charted lower lows and lower highs, putting SOL in a clear downtrend. Until this is reversed, the bears remain in control. Chart by TradingViewTechnical Indicators Trading Volume: The volume peaked during the December 4th crash, and since then it has been decreasing every day as the price fell. This is a good sign for bulls as they may have an opening to take back control from bears. RSI: The daily RSI continues to go lower.
Topics:
Duo Nine considers the following as important: Price Analysis, Solana (SOL) Price, SOLBTC, SOLUSD
This could be interesting, too:
Jordan Lyanchev writes Trump Confirms Work on Strategic Crypto Reserve: XRP, ADA, SOL Included
Chayanika Deka writes Bitcoin Ends Week with 5M Inflows as Multi-Asset Products Face 1M in Losses
Wayne Jones writes Solana Surpasses Ethereum as Top Ecosystem for New Developers in 2024: Report
Jordan Lyanchev writes Solana Whales Begin Accumulation Spree Amid Predictions of SOL at 0
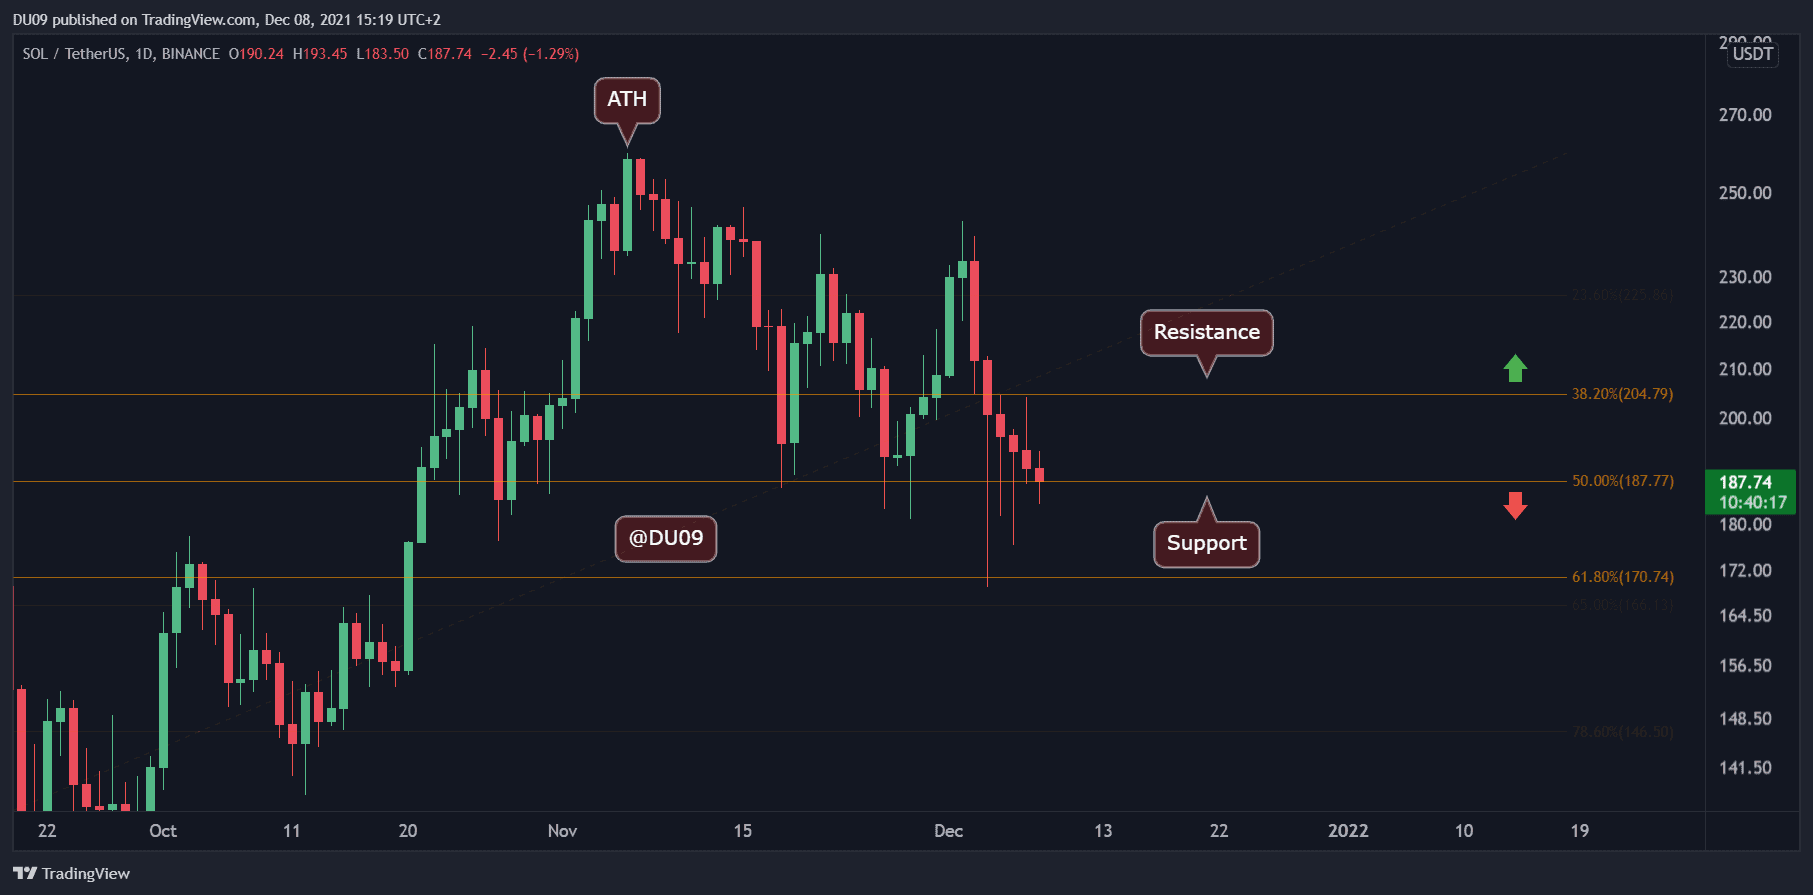
Key Support levels: $187, $170
Key Resistance level: $204
SOL managed to find good support on the $187 level, which may provide some hope when it comes to halting the downtrend. The current resistance sits at $204, and it may take longer for SOL to attempt to breach above it.
Ever since the cryptocurrency made the all-time high at $260, the price has charted lower lows and lower highs, putting SOL in a clear downtrend. Until this is reversed, the bears remain in control.
Technical Indicators
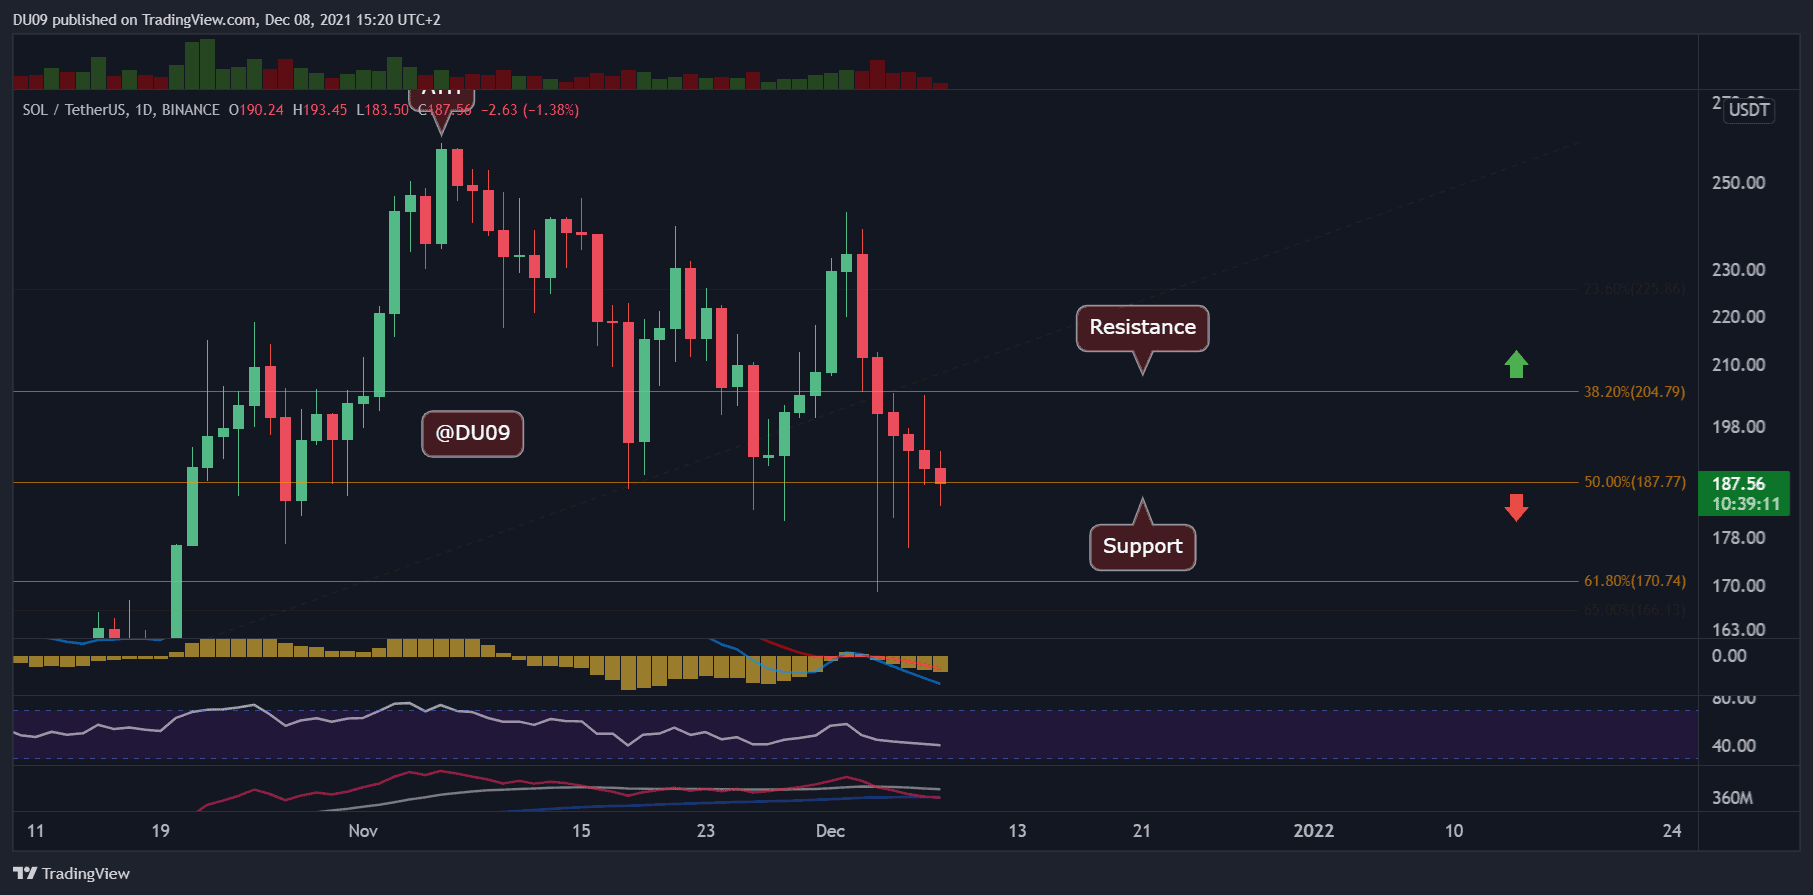
Trading Volume: The volume peaked during the December 4th crash, and since then it has been decreasing every day as the price fell. This is a good sign for bulls as they may have an opening to take back control from bears.
RSI: The daily RSI continues to go lower. If bulls manage to stop the downtrend at the current support level, then the RSI can finally attempt a reversal. On the 4-hour timeframe, the RSI is making higher lows which gives hope to bulls.
MACD: MACD remains bearish on the daily timeframe. The moving averages are expanding, and the histogram is making lower lows. This is a bearish signal, and a reversal seems far away at this time.
Bias
The bias is bearish as long as Solana fails to stop the downtrend.
Short-Term Prediction for SOL Price
Solana had a very poor month in November and a worse start in December with the crash. The price action is in a clear downtrend, and so far, all attempts to stop it failed. If SOL can hold above the key support at $187, then it might enter a consolidation which would flip the bias to neutral.