ADA/USD – ADA Breaks Crucial .80 Resistance Key Support Levels: .80, .71, .60/Key Resistance Levels: .00, .15, .30. ADA found support at .40 (.5 Fib) over the weekend and rebounded higher. On Monday, it broke above a descending trend line and climbed above the 20-day MA. It was trying to break resistance at .80 (bearish .618 Fib) over the past three days but failed to close a daily candle above the level until today. The resistance at .80 stalled the market last week, and if today’s candle can close above, it should set the scene for another bullish leg higher toward .00. ADA/USD Daily Chart. Source: TradingView.ADA-USD Short Term Price Prediction Looking ahead, the first resistance lies at .00 (bearish .786 Fib). This is followed by .15 (bearish
Topics:
Yaz Sheikh considers the following as important: ADABTC, ADAUSD, Cardano (ADA) Price, Price Analysis
This could be interesting, too:
Jordan Lyanchev writes Cardano (ADA) Surpasses Dogecoin After 55% Surge
Jordan Lyanchev writes Trump Confirms Work on Strategic Crypto Reserve: XRP, ADA, SOL Included
Dimitar Dzhondzhorov writes Millions of ADA Sold by Cardano Whales During Market Crash – Will the Decline Continue?
Jordan Lyanchev writes Here’s How Cardano’s 17% Weekly Correction Can Help ADA Hit This Cycle: Analyst
ADA/USD – ADA Breaks Crucial $1.80 Resistance
Key Support Levels: $1.80, $1.71, $1.60/
Key Resistance Levels: $2.00, $2.15, $2.30.
ADA found support at $1.40 (.5 Fib) over the weekend and rebounded higher. On Monday, it broke above a descending trend line and climbed above the 20-day MA. It was trying to break resistance at $1.80 (bearish .618 Fib) over the past three days but failed to close a daily candle above the level until today.
The resistance at $1.80 stalled the market last week, and if today’s candle can close above, it should set the scene for another bullish leg higher toward $2.00.
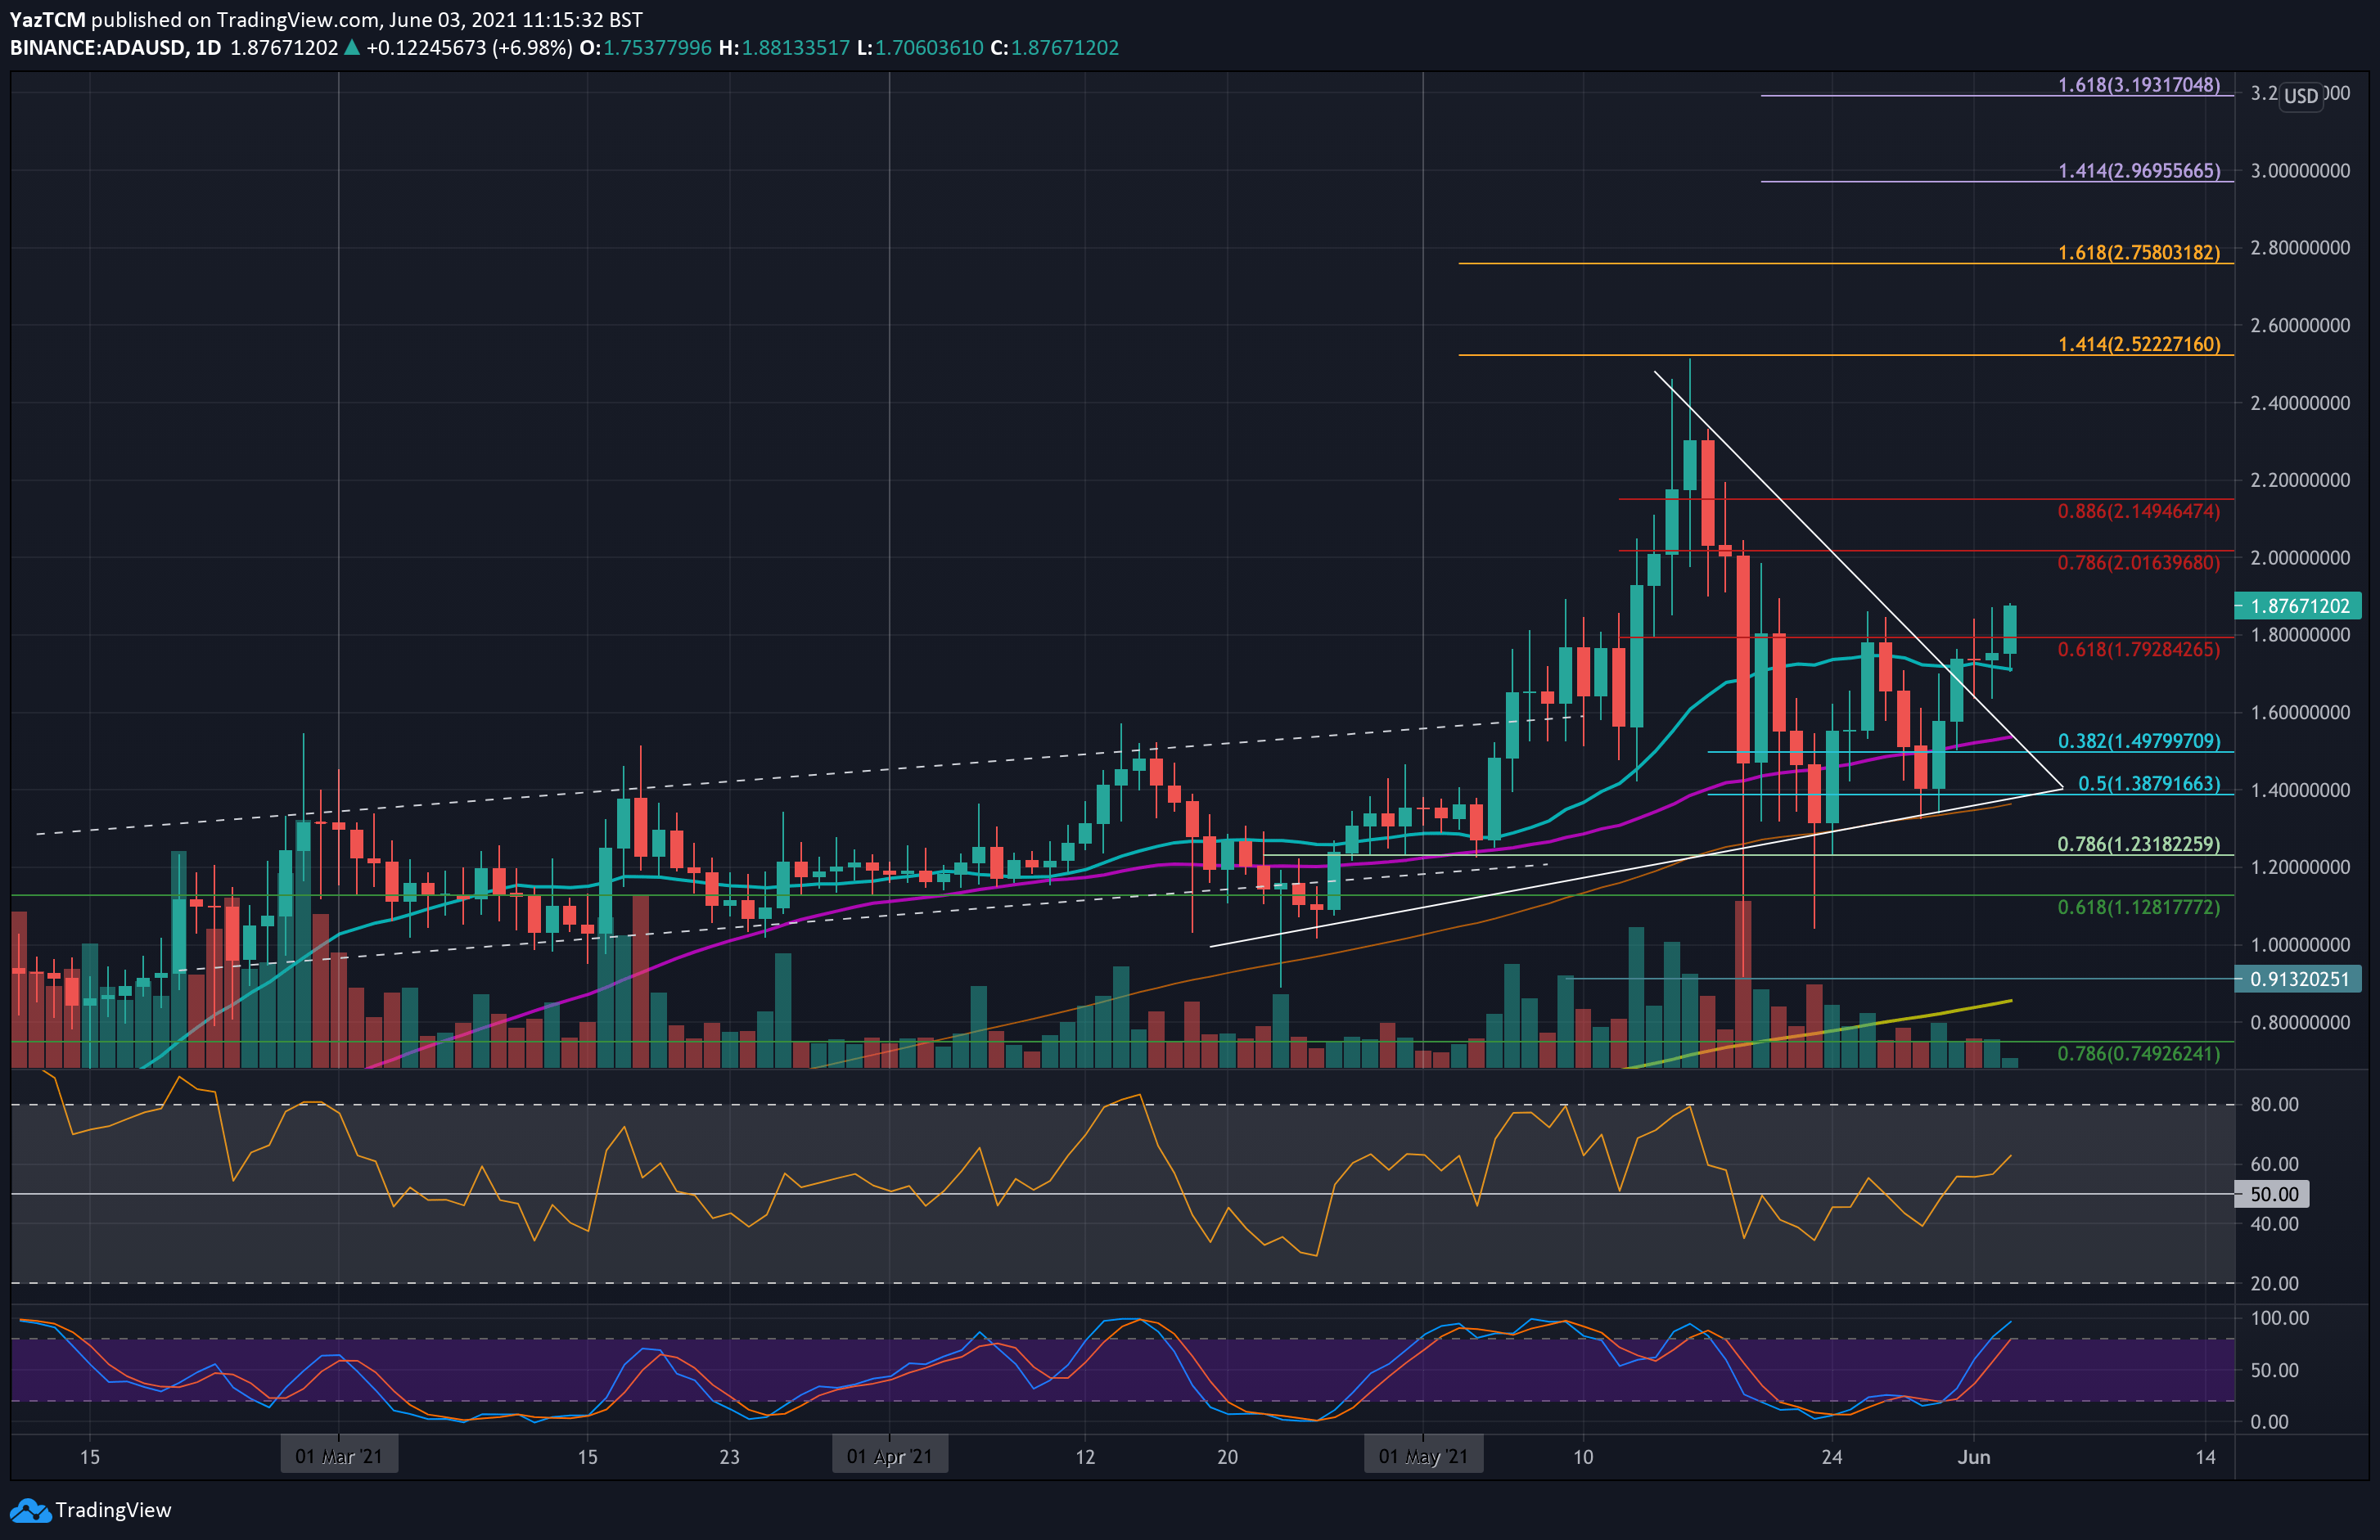
ADA-USD Short Term Price Prediction
Looking ahead, the first resistance lies at $2.00 (bearish .786 Fib). This is followed by $2.15 (bearish .886 Fib), $2.30 (ATH-day closing price), and $2.52 (ATH).
On the other side, the first support lies at $1.80. This is followed by $1.71 (20-day MA), $1.60, and $1.50 (50-day MA).
The RSI is above the midline and is starting to climb higher, indicating that the bullish momentum is on the rise. The increased bullish momentum should certainly help ADA reach the $2.00 level.
ADA/BTC – ADA Targets ATH At 5000 SAT
Key Support Levels: 4900 SAT, 5000 SAT, 5500 SAT.
Key Resistance Levels: 4740 SAT, 4375 SAt, 4000 SAT.
Against bitcoin, ADA is performing well this week after rebounding from the weekend support at 4000 SAT and breaking the upper angle of a symmetrical triangle at 4500 SAT.
Since then, ADA managed to scratch 4900 SAT (1.618 Fib Extension) yesterday and is range-bound between this resistance at 4570 SAT. A break above 4900 SAT should certainly allow ADA to test and break the previous ATH at 5000 SAT.
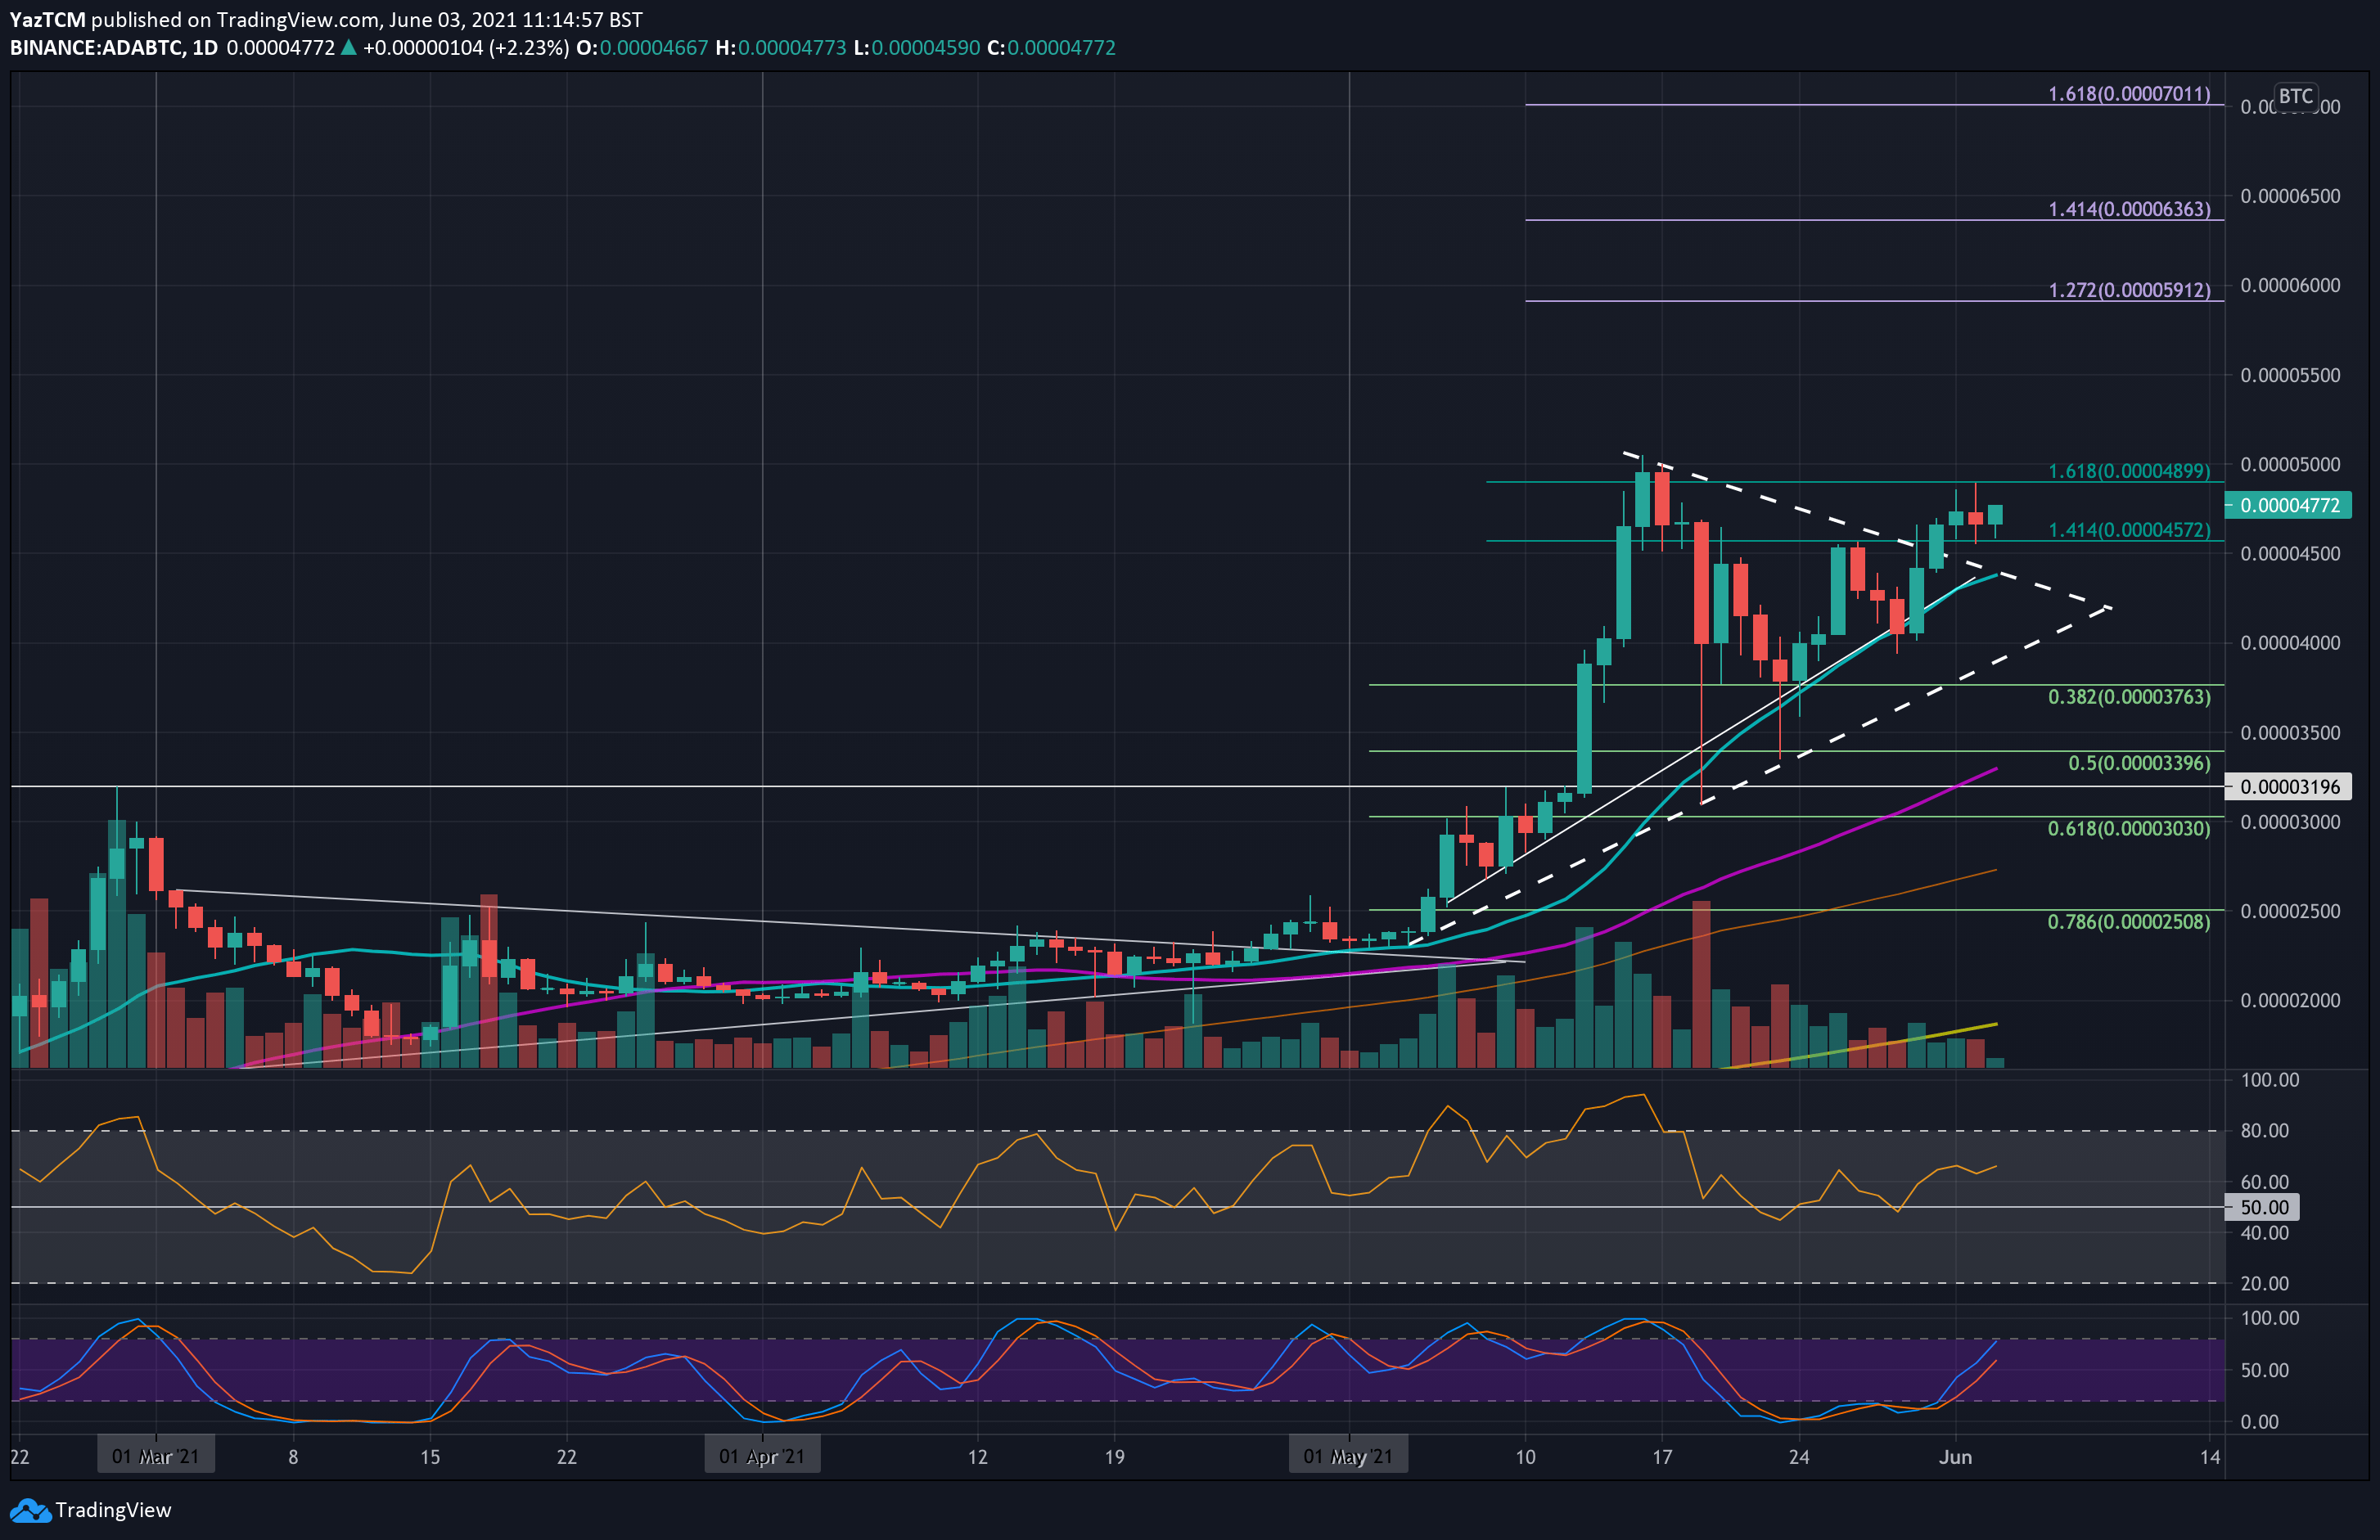
ADA-BTC Short Term Price Prediction
Moving forward, the first resistance lies at 4900 SAT (1.618 Fib Extension). This is followed by 5000 SAT (ATH). Beyond the ATH, resistance is expected at 5500 SAT, 5910 SAT (1.272 Fib Extension), 6000 SAT, and 6363 SAT (1.414 Fib Extension).
On the other side, the first support lies at 4740 SAT. This is followed by 4375 ST (20-day MA), 4000 SAT, and 3760 SAT (.382 Fib).
The RSI is also climbing here as the bulls start to gain some momentum. There is still plenty of room for the RSI to push higher before the market becomes overbought, indicating this is just the start of this bullish leg.