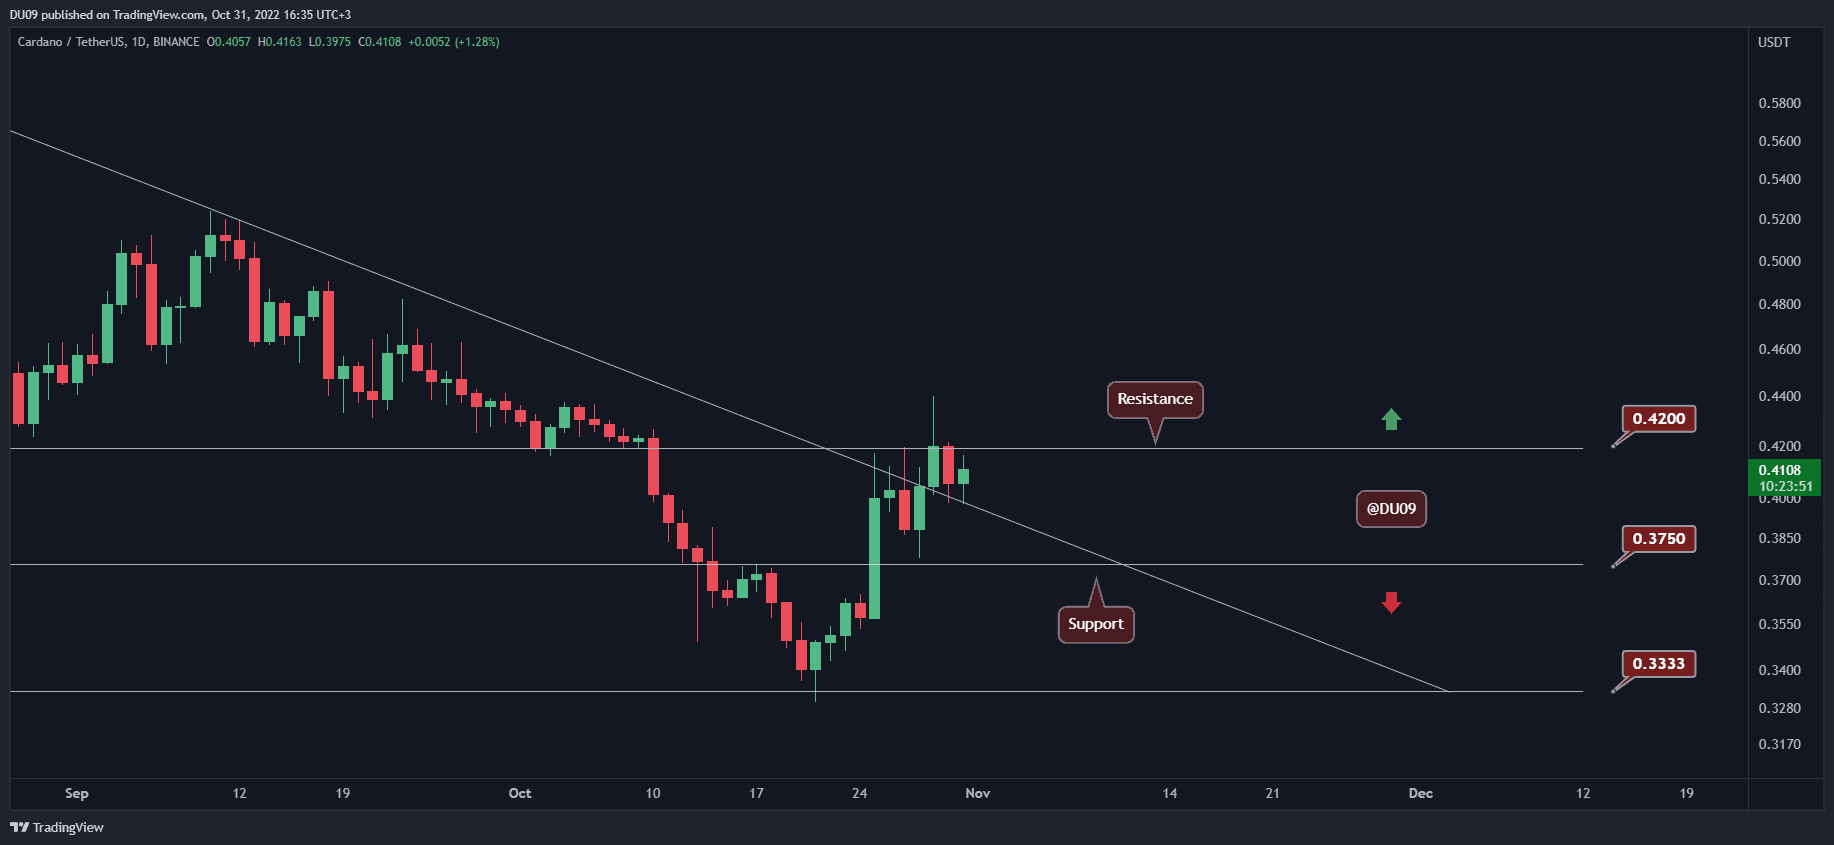
Cardano had an excellent week after a significant rally. However, the momentum appears to be stalling now. Key Support levels: %excerpt%.38, %excerpt%.33 Key Resistance levels: %excerpt%.42, %excerpt%.50 As soon as ADA moved above %excerpt%.40, the bulls were unable to take the price much higher as they were stopped by the key resistance at %excerpt%.42. The support is at %excerpt%.38, and buyers managed to use this level as a pivot for their most recent rally. Should they fail to break the resistance, then ADA could fall back to the key support. Chart by TradingViewTechnical Indicators Trading Volume: The volume has been declining ever since ADA broke above %excerpt%.40. This is not encouraging for bulls. RSI: The daily RSI remains above 50 points but is struggling to move higher. MACD: The daily MACD is bullish. However, the
Topics:
Duo Nine considers the following as important: ADABTC, ADAUSD, Cardano (ADA) Price, Price Analysis
This could be interesting, too:
Jordan Lyanchev writes Cardano (ADA) Surpasses Dogecoin After 55% Surge
Jordan Lyanchev writes Trump Confirms Work on Strategic Crypto Reserve: XRP, ADA, SOL Included
Dimitar Dzhondzhorov writes Millions of ADA Sold by Cardano Whales During Market Crash – Will the Decline Continue?
Jordan Lyanchev writes Here’s How Cardano’s 17% Weekly Correction Can Help ADA Hit This Cycle: Analyst
Cardano had an excellent week after a significant rally. However, the momentum appears to be stalling now.
Key Support levels: $0.38, $0.33
Key Resistance levels: $0.42, $0.50
As soon as ADA moved above $0.40, the bulls were unable to take the price much higher as they were stopped by the key resistance at $0.42. The support is at $0.38, and buyers managed to use this level as a pivot for their most recent rally. Should they fail to break the resistance, then ADA could fall back to the key support.
Technical Indicators
Trading Volume: The volume has been declining ever since ADA broke above $0.40. This is not encouraging for bulls.
RSI: The daily RSI remains above 50 points but is struggling to move higher.
MACD: The daily MACD is bullish. However, the histogram has made a lower high which could signal a possible reversal in the current trend if this continues.

Bias
The bias for ADA is neutral.
Short-Term Prediction for ADA Price
ADA appears to be found at a crossroads, with the price stuck between $0.38 and $0.42. A clean break from this range is necessary to allow the price to attract new volume and expand further. The weekly timeframe remains bullish. Hence, ADA has a better chance of moving above the key resistance and towards half a dollar in the future.