Key Support levels: , %excerpt%.78 Key Resistance levels: .2, .6 ADA’s bullish momentum took it all the way to .2, which was the main target for this rally. At the time of this writing, it seems unlikely for ADA to break above this level, and a short pullback might be in the cards. The major support is found at , but ADA may not fall that low if buyers remain interested. Chart by TradingViewTechnical Indicators Trading Volume: The volume is decreasing, and this supports the case for a short pullback as bulls may need to consolidate following the recent rally. RSI: The daily RSI has reached the oversold area at over 70 points and is now curving down. A correction is likely. MACD: The daily MACD is bullish, but the histogram is making lower highs. This is a clear sign of
Topics:
Duo Nine considers the following as important: ADABTC, ADAUSD, Cardano (ADA) Price, Price Analysis
This could be interesting, too:
Jordan Lyanchev writes Cardano (ADA) Surpasses Dogecoin After 55% Surge
Jordan Lyanchev writes Trump Confirms Work on Strategic Crypto Reserve: XRP, ADA, SOL Included
Dimitar Dzhondzhorov writes Millions of ADA Sold by Cardano Whales During Market Crash – Will the Decline Continue?
Jordan Lyanchev writes Here’s How Cardano’s 17% Weekly Correction Can Help ADA Hit This Cycle: Analyst
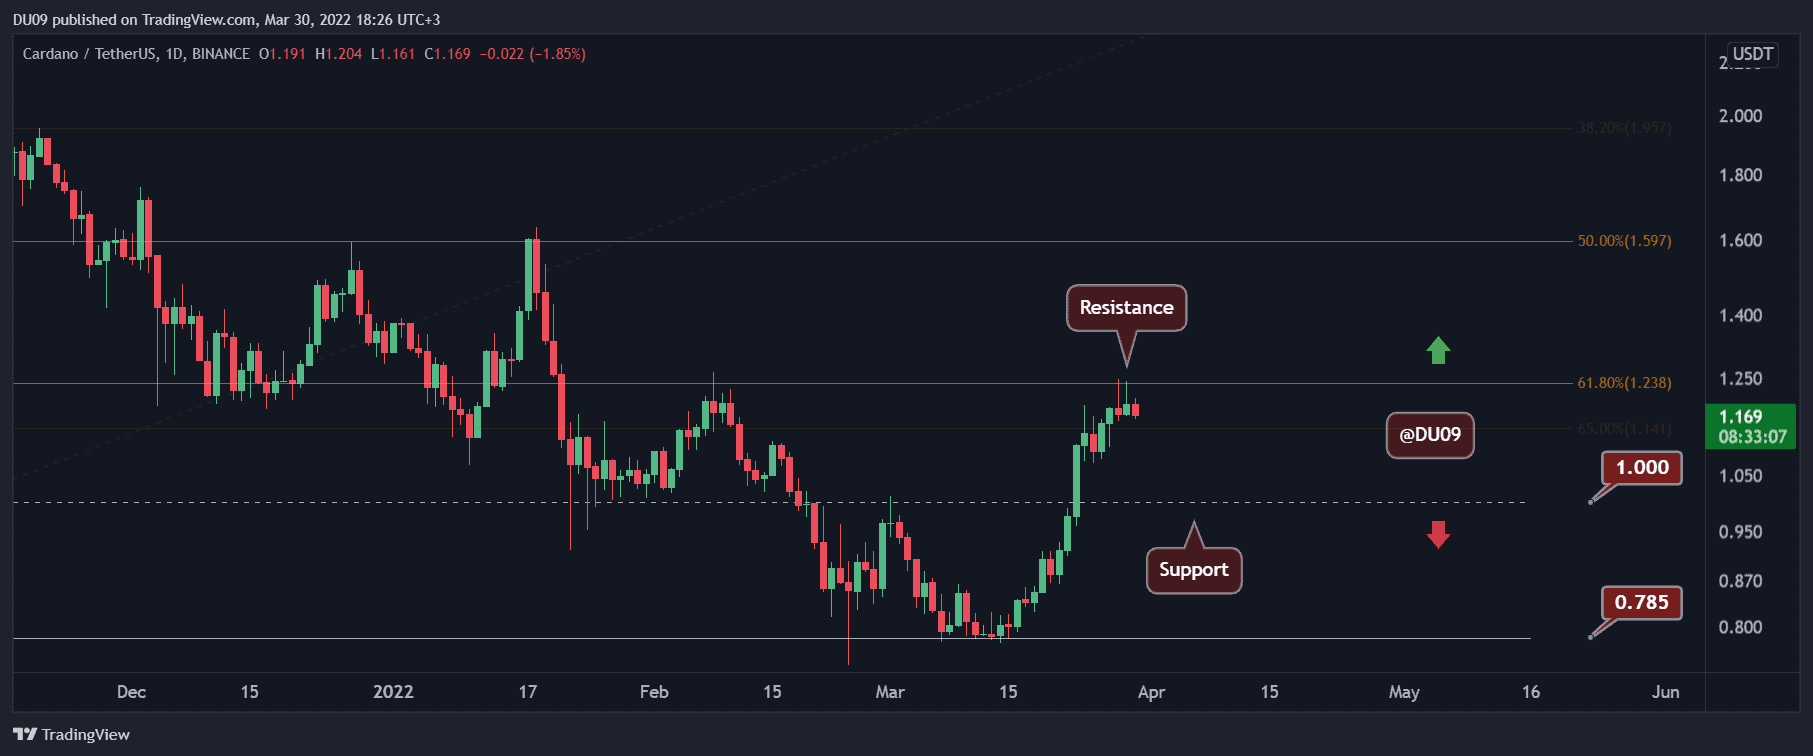
Key Support levels: $1, $0.78
Key Resistance levels: $1.2, $1.6
ADA’s bullish momentum took it all the way to $1.2, which was the main target for this rally. At the time of this writing, it seems unlikely for ADA to break above this level, and a short pullback might be in the cards. The major support is found at $1, but ADA may not fall that low if buyers remain interested.
Technical Indicators
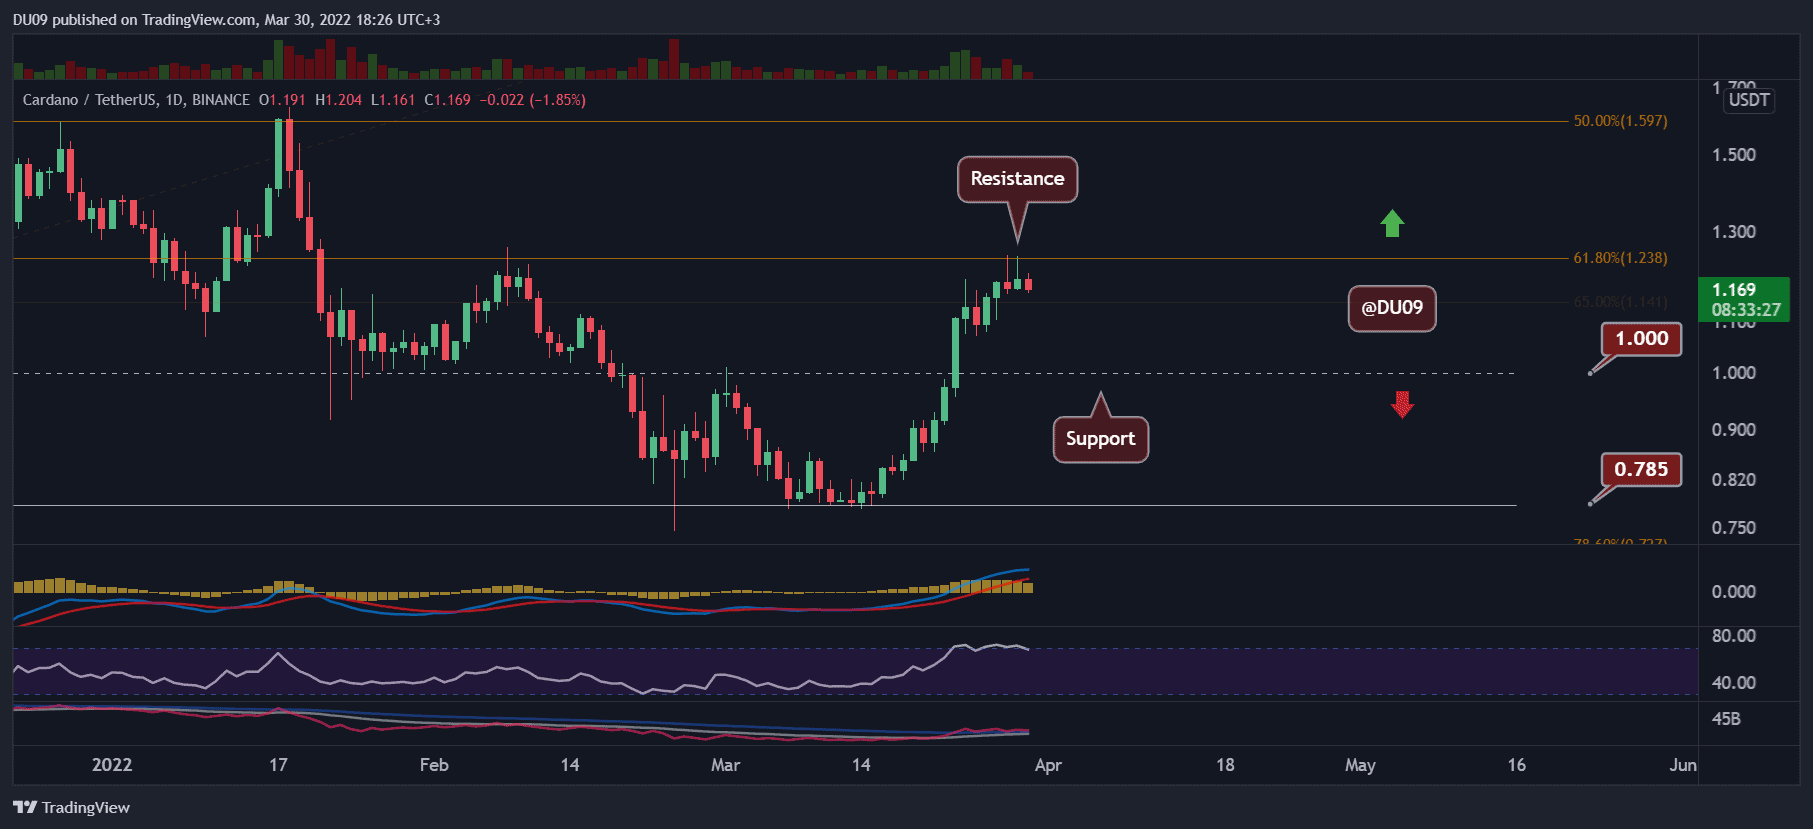
Trading Volume: The volume is decreasing, and this supports the case for a short pullback as bulls may need to consolidate following the recent rally.
RSI: The daily RSI has reached the oversold area at over 70 points and is now curving down. A correction is likely.
MACD: The daily MACD is bullish, but the histogram is making lower highs. This is a clear sign of momentum shifting in favor of the bears.
Bias
The bias remains bullish so long ADA maintains a price above $1.
Short-Term Prediction for ADA Price
ADA may enter a short correction as the bulls have reached a critical level at $1.2. The price could fall back to the key support at $1, but in any case, it’s important to be prepared for volatility.