The first week of 2022 is about to become one of the most bearish weeks in crypto over the past year. Just as the overall sentiment, ADA could not resist the downtrend and is slowly descending towards the mark. Key Support levels: , %excerpt%.8 Key Resistance level: .2, .5 The support at .2 could not hold off the selling pressure as the price closed below this critical level on the daily timeframe yesterday. The latter becomes the first major level of resistance. On the other hand, the nearest support now lies at , and ADA appears on a clear path to test this critical area. Chart by TradingViewTechnical Indicators Trading Volume: The volume level was not significant when the price dropped below .2, probably because this happened during the weekend. This shows some
Topics:
Duo Nine considers the following as important: ADABTC, ADAUSD, Cardano (ADA) Price, Price Analysis
This could be interesting, too:
Jordan Lyanchev writes Cardano (ADA) Surpasses Dogecoin After 55% Surge
Jordan Lyanchev writes Trump Confirms Work on Strategic Crypto Reserve: XRP, ADA, SOL Included
Dimitar Dzhondzhorov writes Millions of ADA Sold by Cardano Whales During Market Crash – Will the Decline Continue?
Jordan Lyanchev writes Here’s How Cardano’s 17% Weekly Correction Can Help ADA Hit This Cycle: Analyst
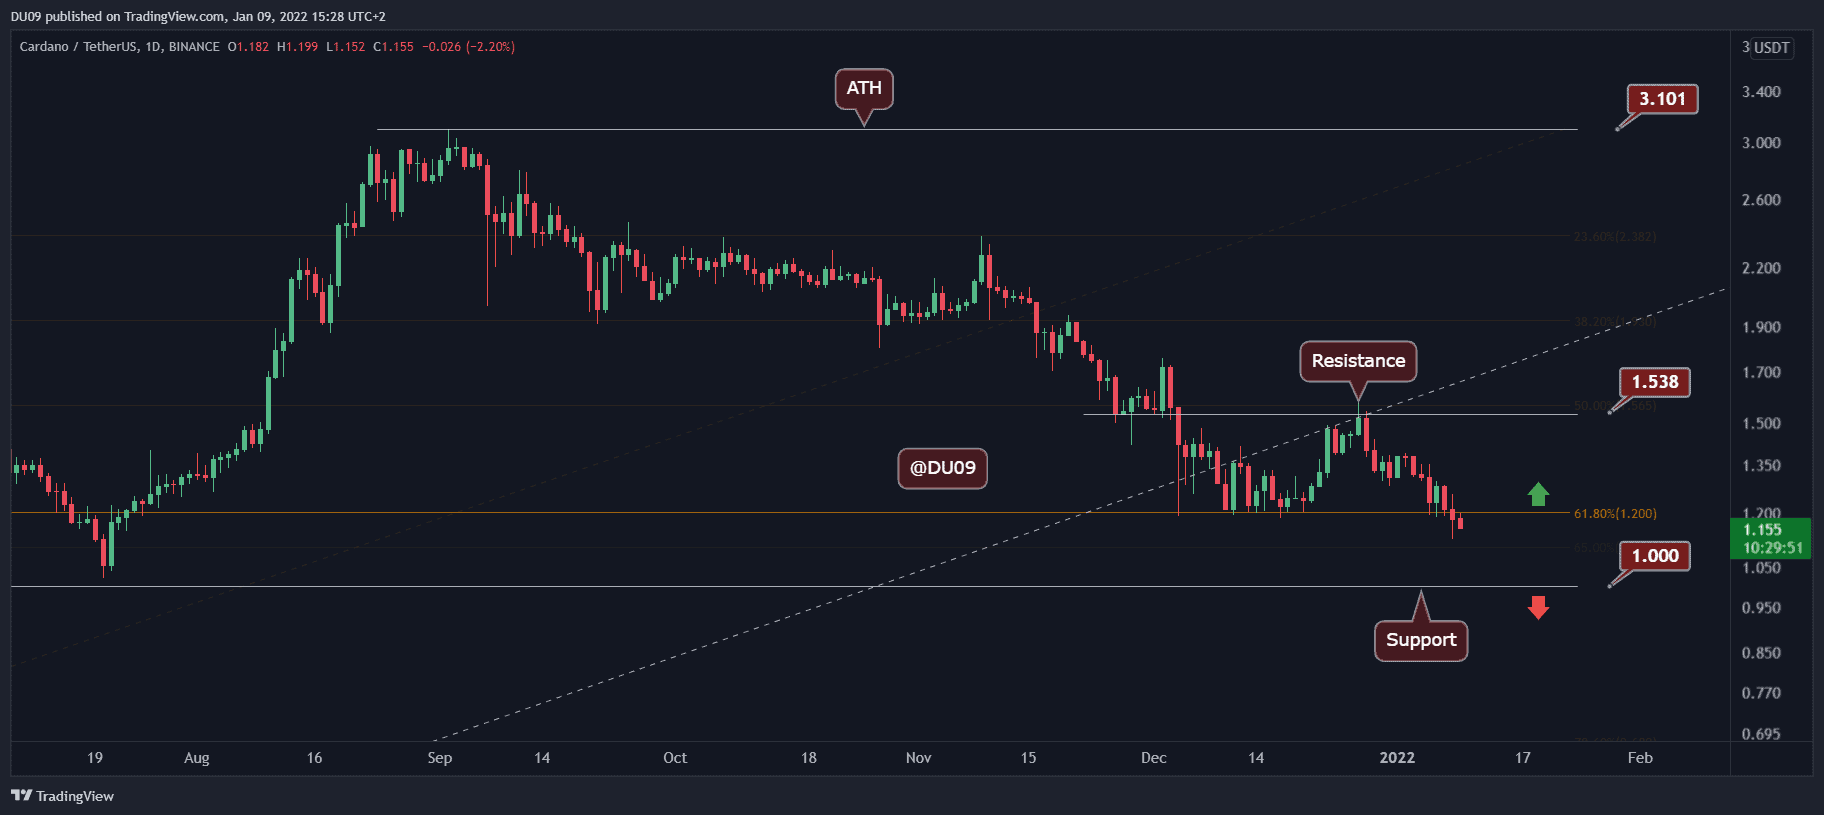
The first week of 2022 is about to become one of the most bearish weeks in crypto over the past year. Just as the overall sentiment, ADA could not resist the downtrend and is slowly descending towards the $1 mark.
Key Support levels: $1, $0.8
Key Resistance level: $1.2, $1.5
The support at $1.2 could not hold off the selling pressure as the price closed below this critical level on the daily timeframe yesterday. The latter becomes the first major level of resistance. On the other hand, the nearest support now lies at $1, and ADA appears on a clear path to test this critical area.
Technical Indicators
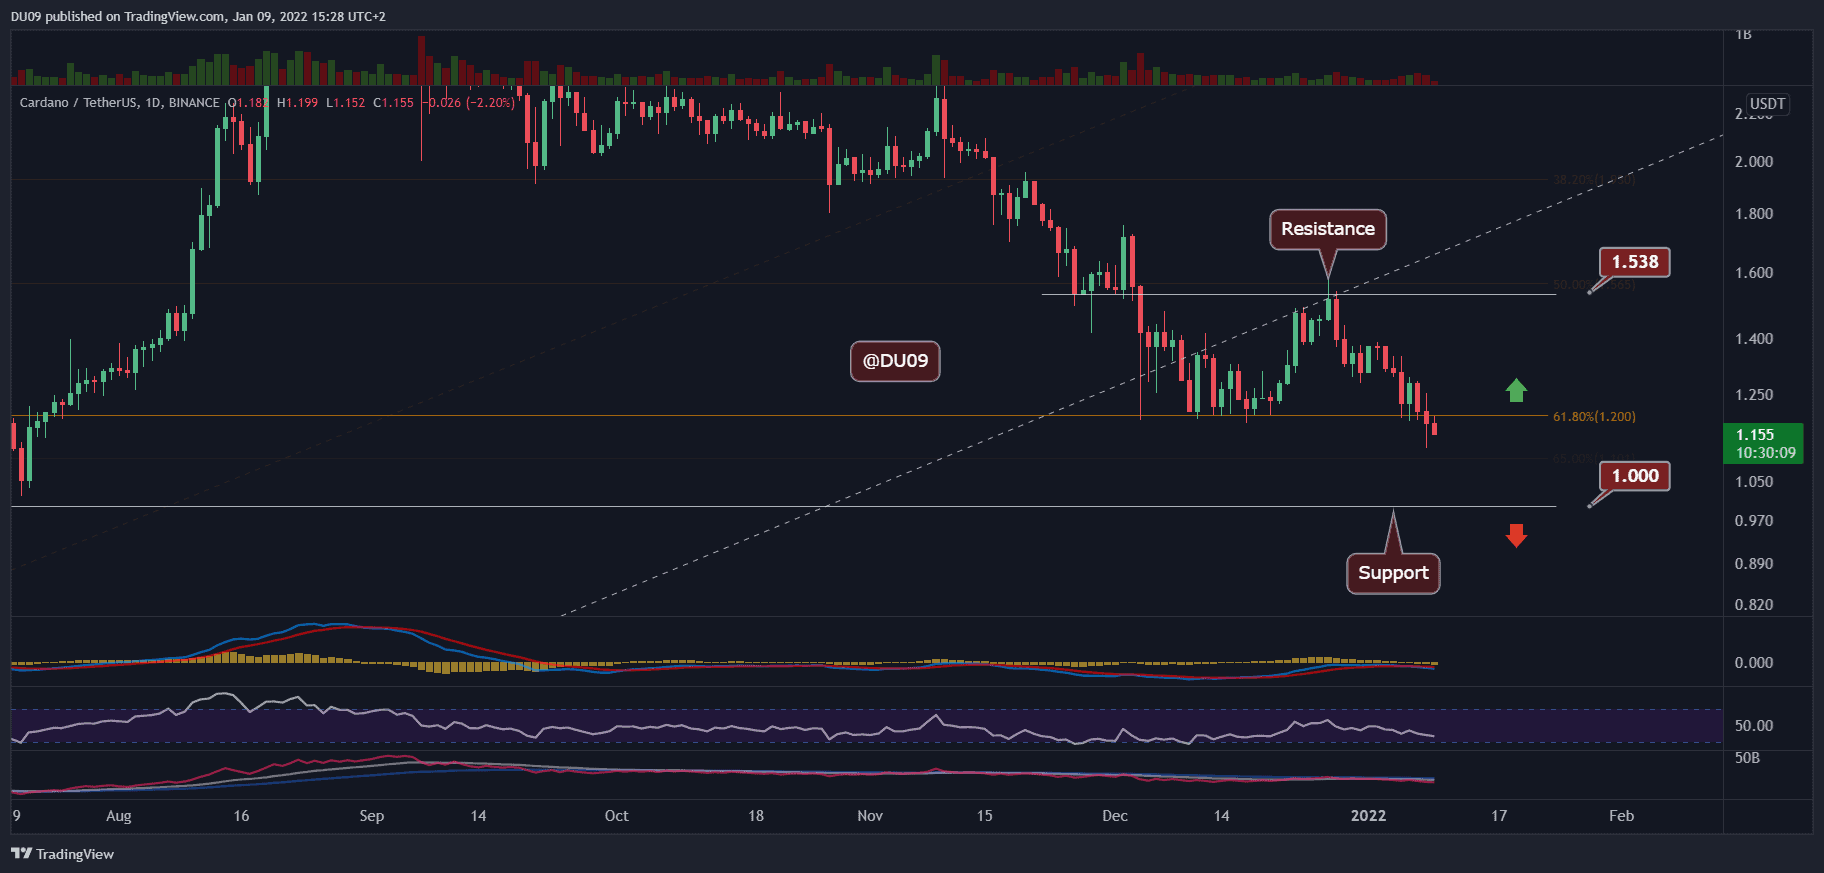
Trading Volume: The volume level was not significant when the price dropped below $1.2, probably because this happened during the weekend. This shows some lack of conviction on the sellers’ side and will have to be re-evaluated on Monday.
RSI: The daily RSI continues to slip after going through a lower high. The short-term trend is clearly bearish, however, the RSI has not reached the oversold area, sitting at 37 points at the time of this writing.
MACD: The MACD is also bearish after the histogram and moving averages crossed to the negative side last Wednesday once the crypto market selloff started. Since then, the bearish momentum has only intensified and there are no signs of a reversal yet. For this reason, ADA is likely to test the $1 level.
Bias
The current bias is bearish.
Short-Term Prediction for ADA Price
The support at $1.2 failed to cease the negative momentum, which has only increased over the past few days. As mentioned above, ADA must hold the $1 mark as this is a key psychological support, which buyers must defend. If nothing major takes place, we can expect to see ADA retest this critical level in the coming days.