Key Support levels: Key Resistance levels: After a significant breakout from the rising wedge (marked blue on the following chart), NEAR is just under , which is currently acting as resistance. This is the next key resistance to consider. The cryptocurrency painted a fresh all-time high hours ago, and it’s essential to go above the level to continue its rally. Chart by TradingViewTechnical Indicators Trading Volume: Significant volume since the breakout above the wedge. The longer this is sustained, the better chances NEAR has to break the key resistance. However, right now, the volume does show some weakness after the breakout. It is important for buyers to maintain the momentum, otherwise, the price can fall back on support. RSI: The daily RSI must make a
Topics:
Duo Nine considers the following as important: Near Protocol (NEAR), Price Analysis
This could be interesting, too:
CryptoVizArt writes ETH’s Path to K Involves Maintaining This Critical Support (Ethereum Price Analysis)
Duo Nine writes Crypto Price Analysis June-29: ETH, XRP, ADA, DOGE, and DOT
Dimitar Dzhondzhorov writes Top 10 AI Cryptos to Watch in June by This Important Metric
Duo Nine writes Crypto Price Analysis June-15: ETH, XRP, ADA, DOGE, and DOT
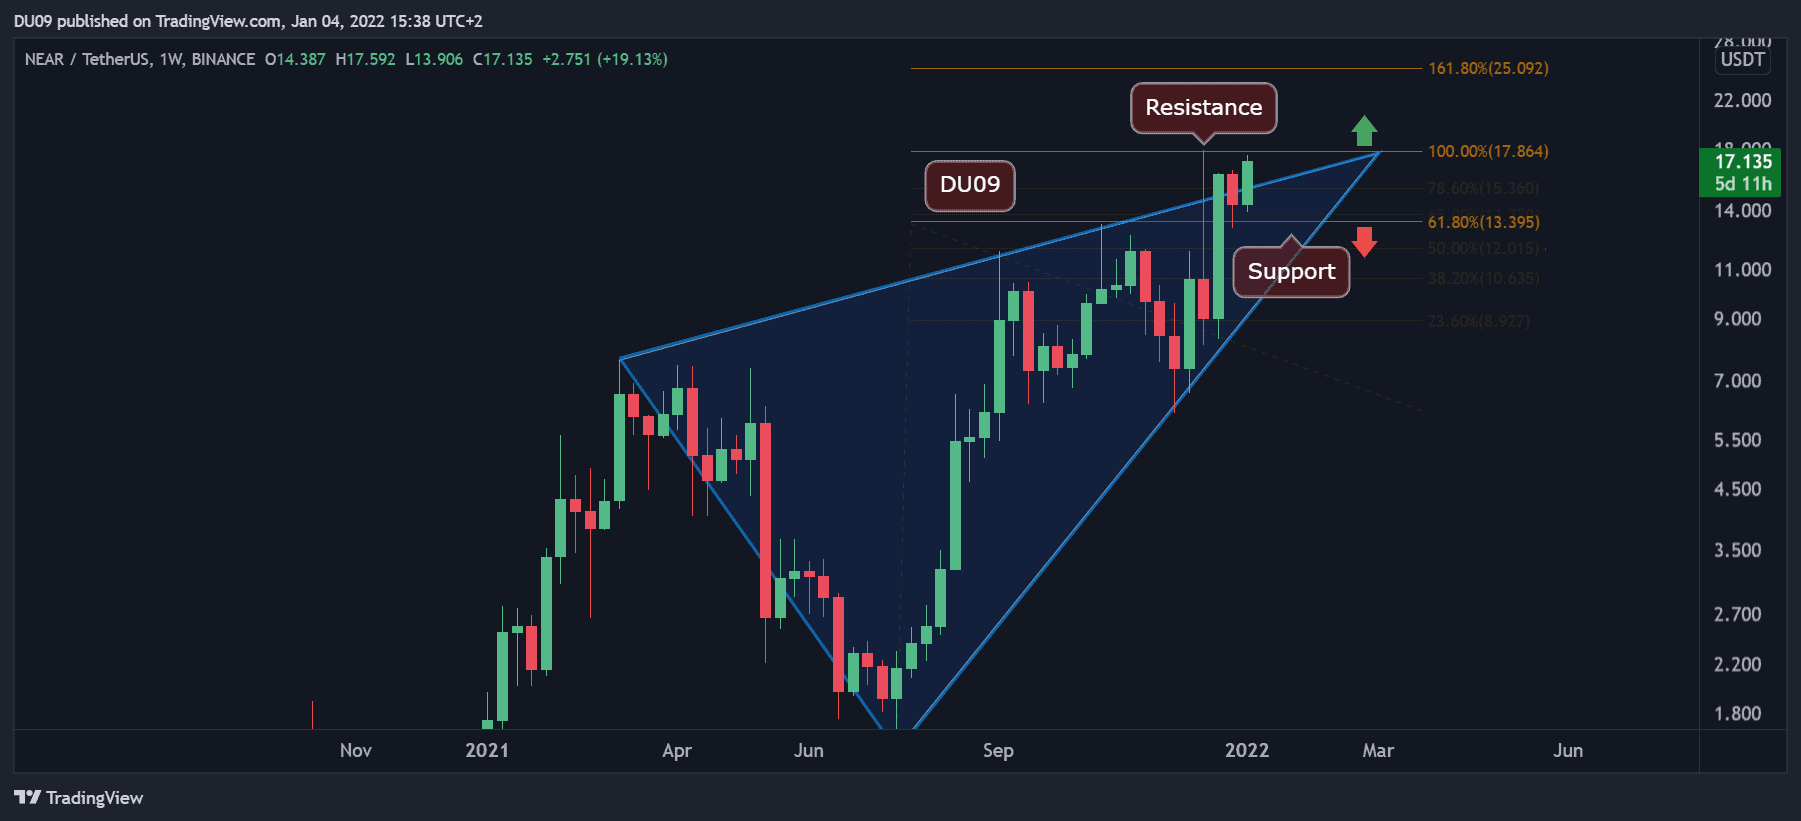
Key Support levels: $13
Key Resistance levels: $18
After a significant breakout from the rising wedge (marked blue on the following chart), NEAR is just under $18, which is currently acting as resistance. This is the next key resistance to consider. The cryptocurrency painted a fresh all-time high hours ago, and it’s essential to go above the level to continue its rally.
Technical Indicators
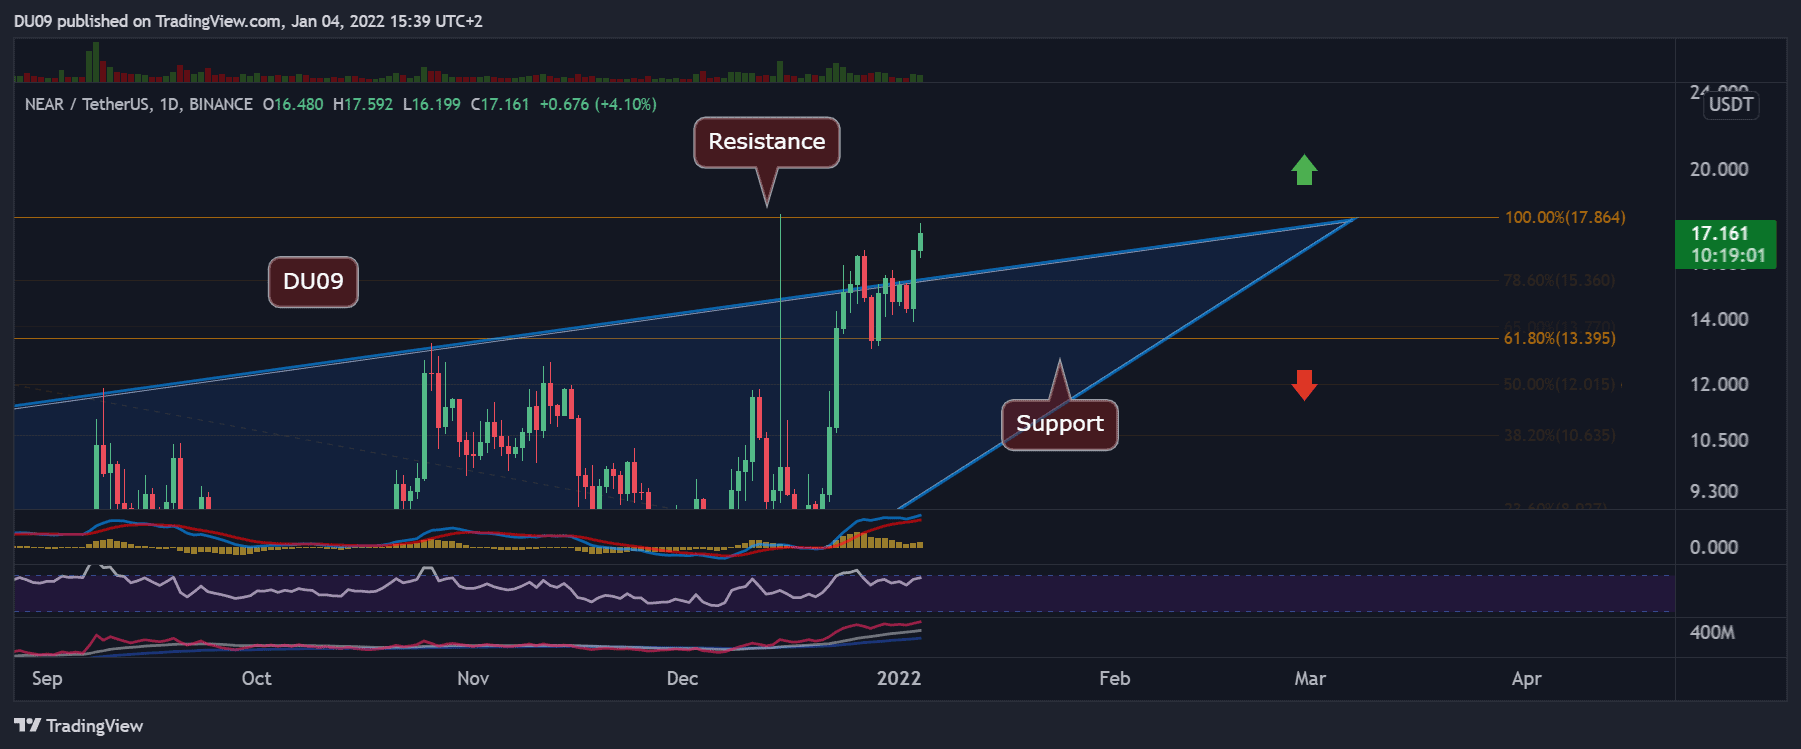
Trading Volume: Significant volume since the breakout above the wedge. The longer this is sustained, the better chances NEAR has to break the key resistance. However, right now, the volume does show some weakness after the breakout. It is important for buyers to maintain the momentum, otherwise, the price can fall back on support.
RSI: The daily RSI must make a higher high soon, otherwise the current price action will form a bearish divergence (higher price, lower RSI). This would be another indicator that momentum is fading.
MACD: The daily MACD is bullish and looks ready for a new rally. However, the $18 resistance needs to be broken to allow the price to go higher.
Bias
The bias for NEAR is b. However, the indicators give some mixed messages whereby momentum may be fading. If the cryptocurrency fails to break the $18 resistance then a pullback becomes likely.
Short-Term Price Prediction for NEAR
NEAR has had an excellent rally in the past few weeks, fueled by the growing ecosystem and decentralized applications that are running on the protocol. These fundamentals are likely to continue to make NEAR a good performer in the current market.