Key Support levels: ,600, ,300 Key Resistance levels: ,800, 4,000 ETH has been moving sideways within the falling wedge (marked blue on the following chart). The price is now closing in on the wedge upper border which is currently acting as resistance around the ,800 level. If ETH gathers momentum here, then the bulls have a chance at a breakout. A failure will take the price back unto support at ,600 or even ,300 if the correction will continue. Chart by TradingViewTechnical Indicators Trading Volume: There is nothing impressive on the volume side right now. However, ETH appears to be preparing for a move. RSI: The daily RSI is curving back up, indicating that momentum on the buyers side is picking up. As long as this continues, then price can attempt a break
Topics:
Duo Nine considers the following as important: ETH Analysis, ETHBTC, Ethereum (ETH) Price, ethusd
This could be interesting, too:
Mandy Williams writes Ethereum Derivatives Metrics Signal Modest Downside Tail Risk Ahead: Nansen
Jordan Lyanchev writes Weekly Bitcoin, Ethereum ETF Recap: Light at the End of the Tunnel for BTC
CryptoVizArt writes Will Weak Momentum Drive ETH to .5K? (Ethereum Price Analysis)
Jordan Lyanchev writes Bybit Hack Fallout: Arthur Hayes, Samson Mow Push for Ethereum Rollback
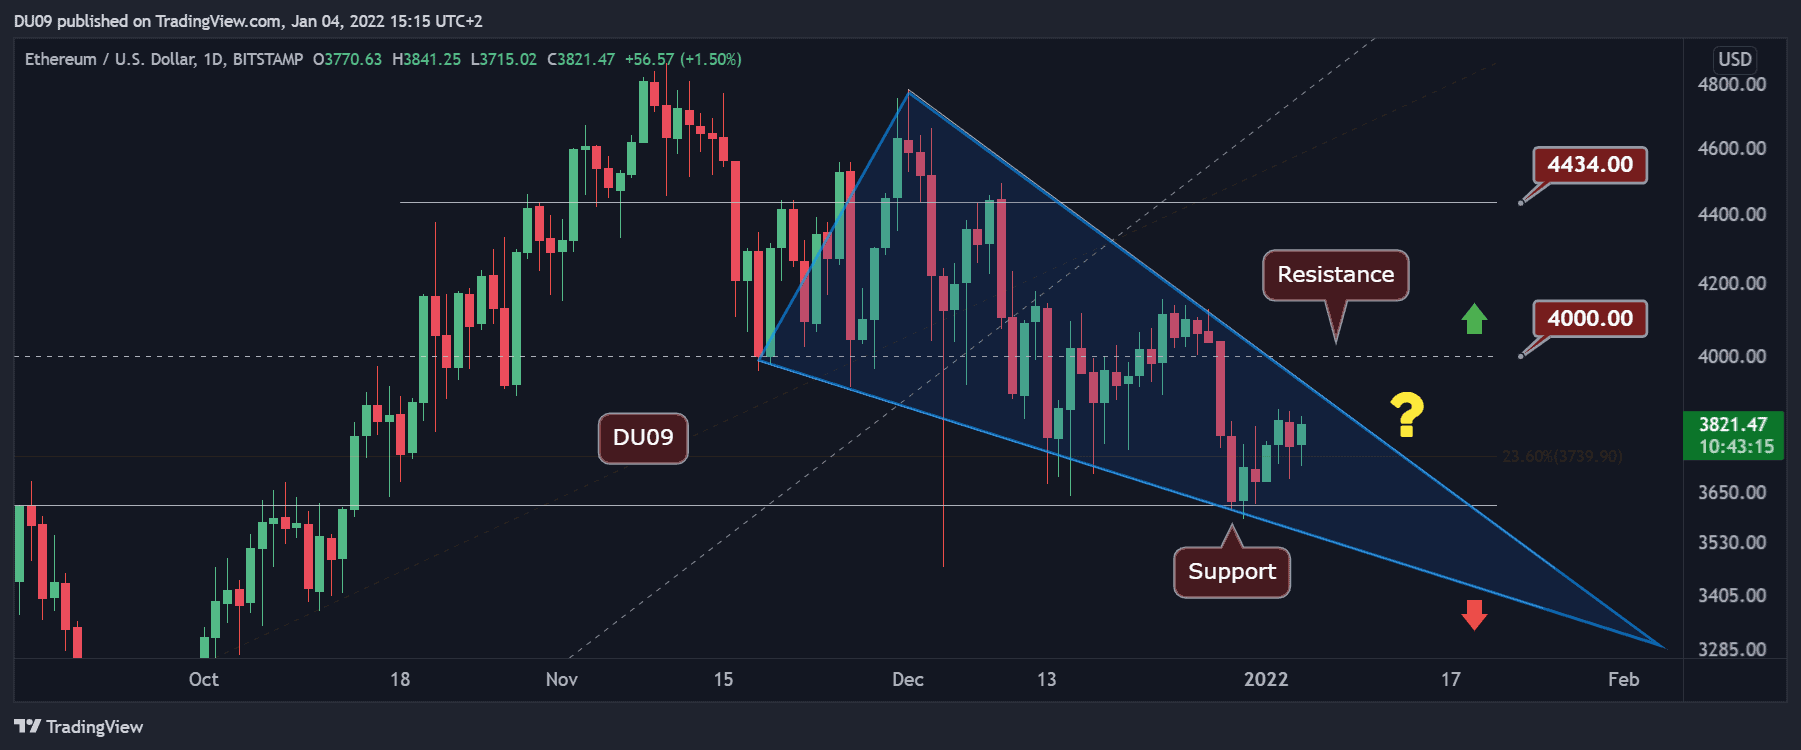
Key Support levels: $3,600, $3,300
Key Resistance levels: $3,800, 4,000
ETH has been moving sideways within the falling wedge (marked blue on the following chart). The price is now closing in on the wedge upper border which is currently acting as resistance around the $3,800 level. If ETH gathers momentum here, then the bulls have a chance at a breakout. A failure will take the price back unto support at $3,600 or even $3,300 if the correction will continue.
Technical Indicators
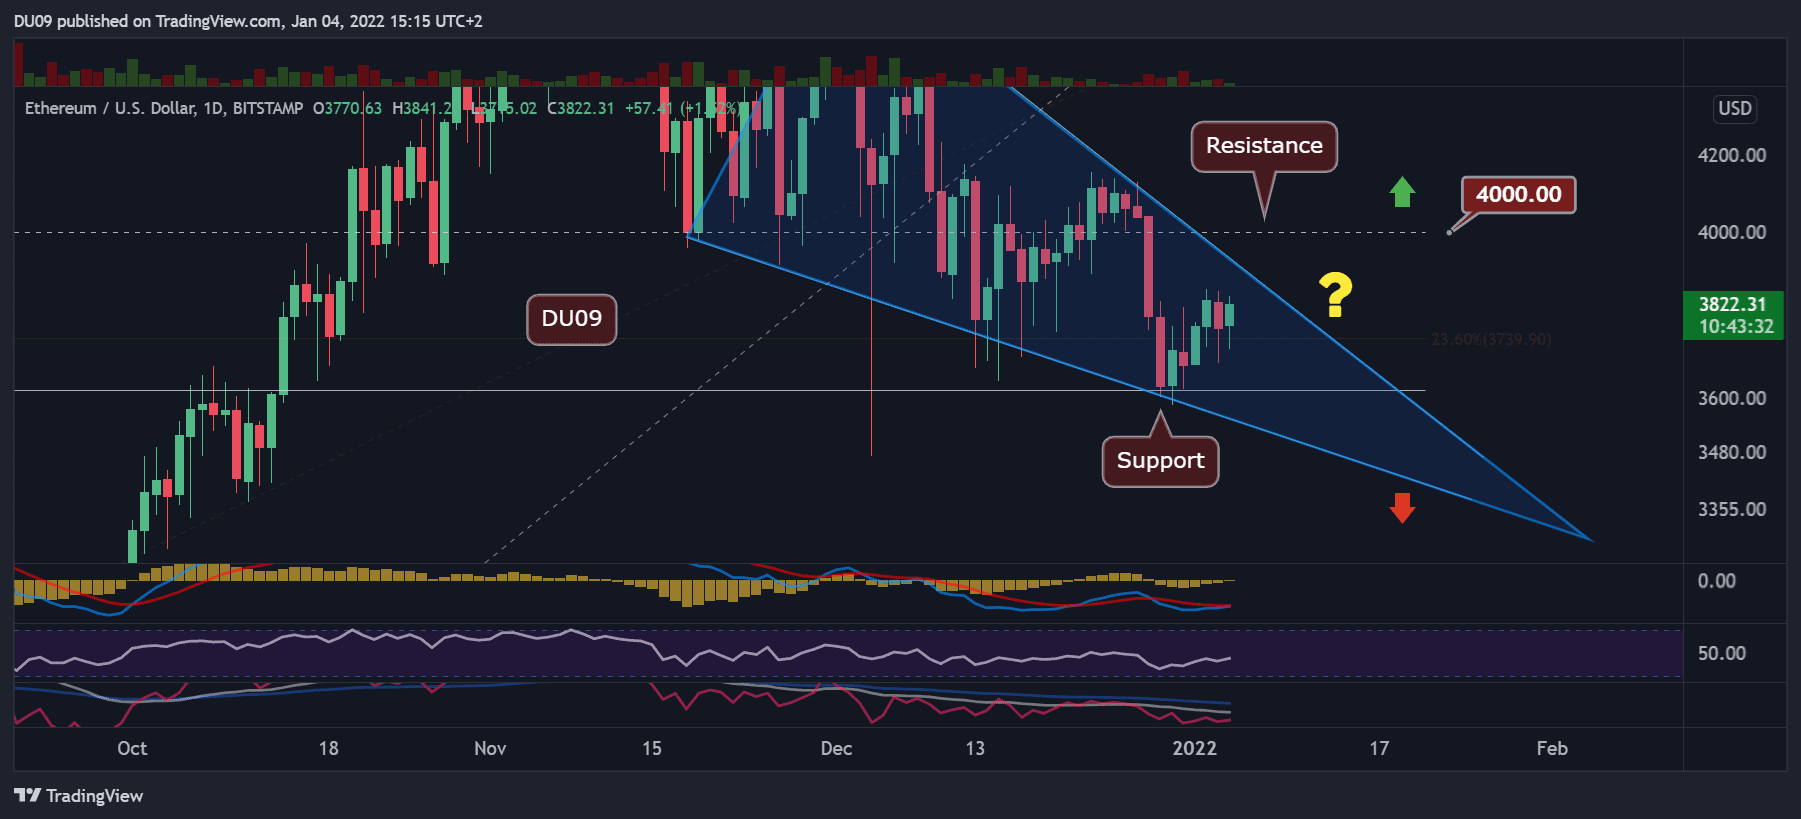
Trading Volume: There is nothing impressive on the volume side right now. However, ETH appears to be preparing for a move.
RSI: The daily RSI is curving back up, indicating that momentum on the buyers side is picking up. As long as this continues, then price can attempt a break of the key resistance.
MACD: The daily MACD is a day away from doing a bullish cross. This is exactly what ETH needs to be able to break above the falling wedge, should momentum pick up. The bullish divergence on the MACD histogram was also an early sign that this could take place. This week may be decisive for that.
Bias
The bias for ETH is neutral. A break above the falling wedge would turn the chart bullish.
Short-Term Price Prediction for ETH
ETH appears to be preparing a possible rally and an escape from the current formation. If successful, it could trigger a nice rally to $4,000 which has been a challenging resistance in the past.
The volume is still timid, but the price will have to decide which way to take next pretty soon and likely before the end of this week. Therefore, volatility is to be expected.