Key Support level: %excerpt%.70 Key Resistance levels: %excerpt%.96, XRP has been caught in a large range since a week ago between the key resistance at %excerpt%.96 and support at %excerpt%.70. After setting a local high at %excerpt%.91, the cryptocurrency has been consolidating without sufficient momentum to break away from this range. The current price action has formed a large pennant (represented in blue on the below chart), which is likely to resolve soon. Chart by TradingViewTechnical Indicators Trading Volume: The volume continues to decline as the consolidation progresses. However, once the price breaks away from the pennant, the volume may return. RSI: The daily RSI has made a lower high and is falling, this suggests a possible bearish scenario in the near term. MACD: Similar to the volume,
Topics:
Duo Nine considers the following as important: Ripple (XRP) Price, XRP Analysis, xrpbtc, xrpusd
This could be interesting, too:
Jordan Lyanchev writes Ripple’s (XRP) Surge to Triggers Over Million in Short Liquidations
Jordan Lyanchev writes Trump Confirms Work on Strategic Crypto Reserve: XRP, ADA, SOL Included
Dimitar Dzhondzhorov writes Is a Major Ripple v. SEC Lawsuit Development Expected This Week? Here’s Why
Mandy Williams writes Ripple Releases Institutional DeFi Roadmap for XRP Ledger in 2025
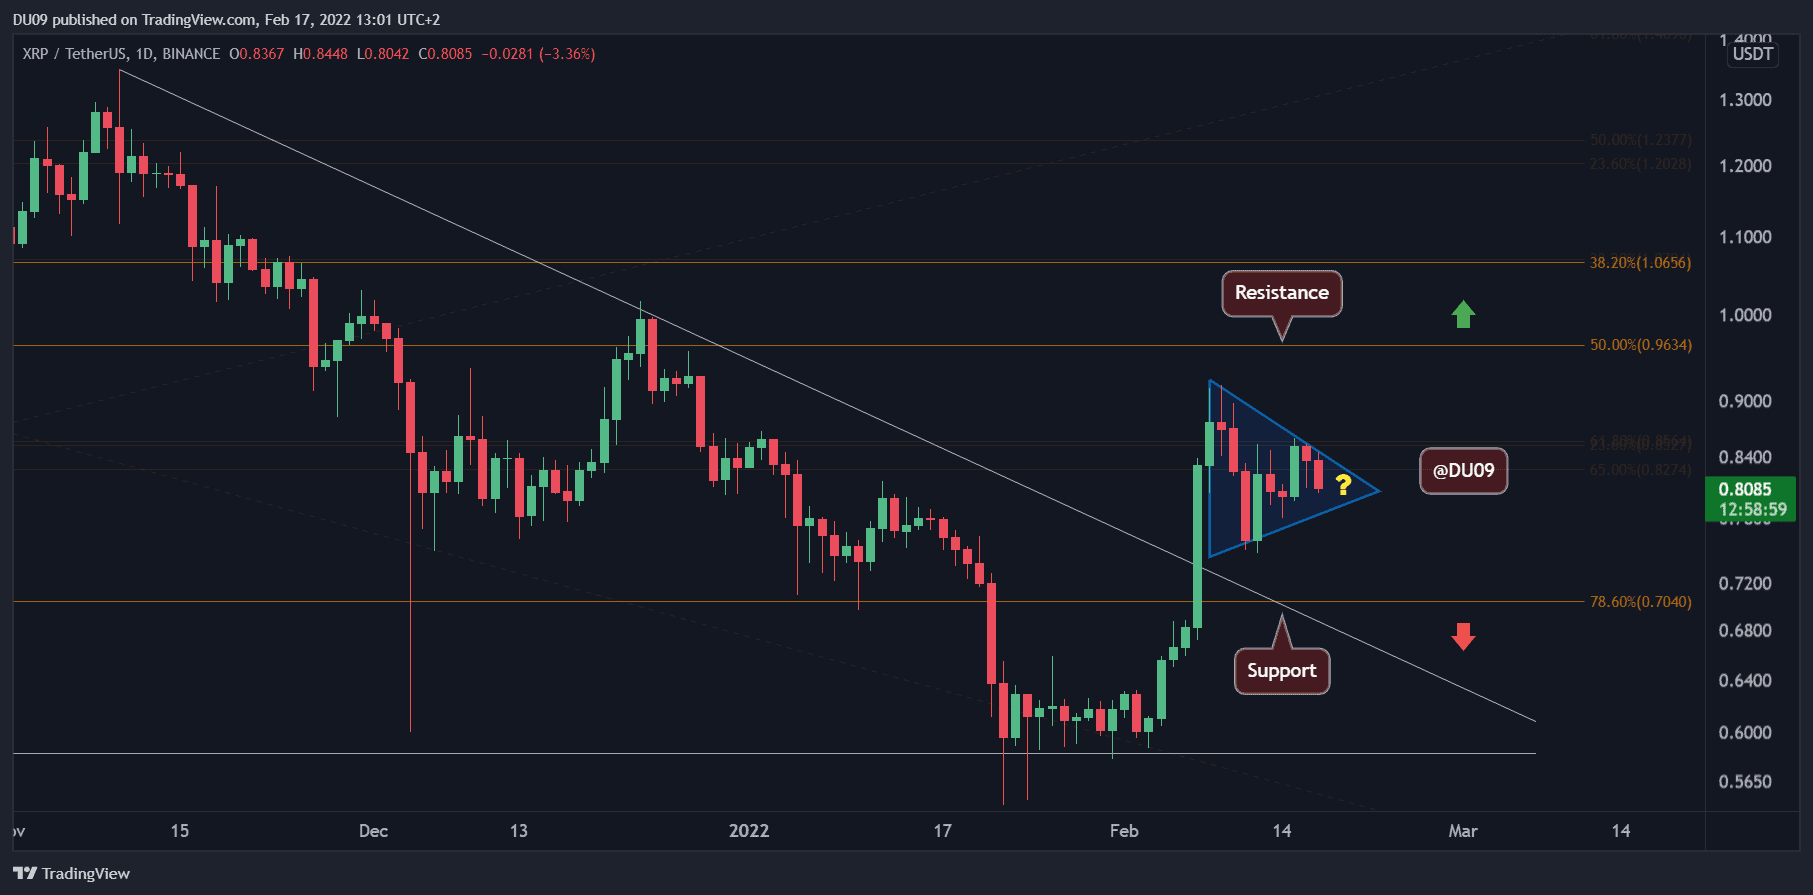
Key Support level: $0.70
Key Resistance levels: $0.96, $1
XRP has been caught in a large range since a week ago between the key resistance at $0.96 and support at $0.70. After setting a local high at $0.91, the cryptocurrency has been consolidating without sufficient momentum to break away from this range.
The current price action has formed a large pennant (represented in blue on the below chart), which is likely to resolve soon.
Technical Indicators
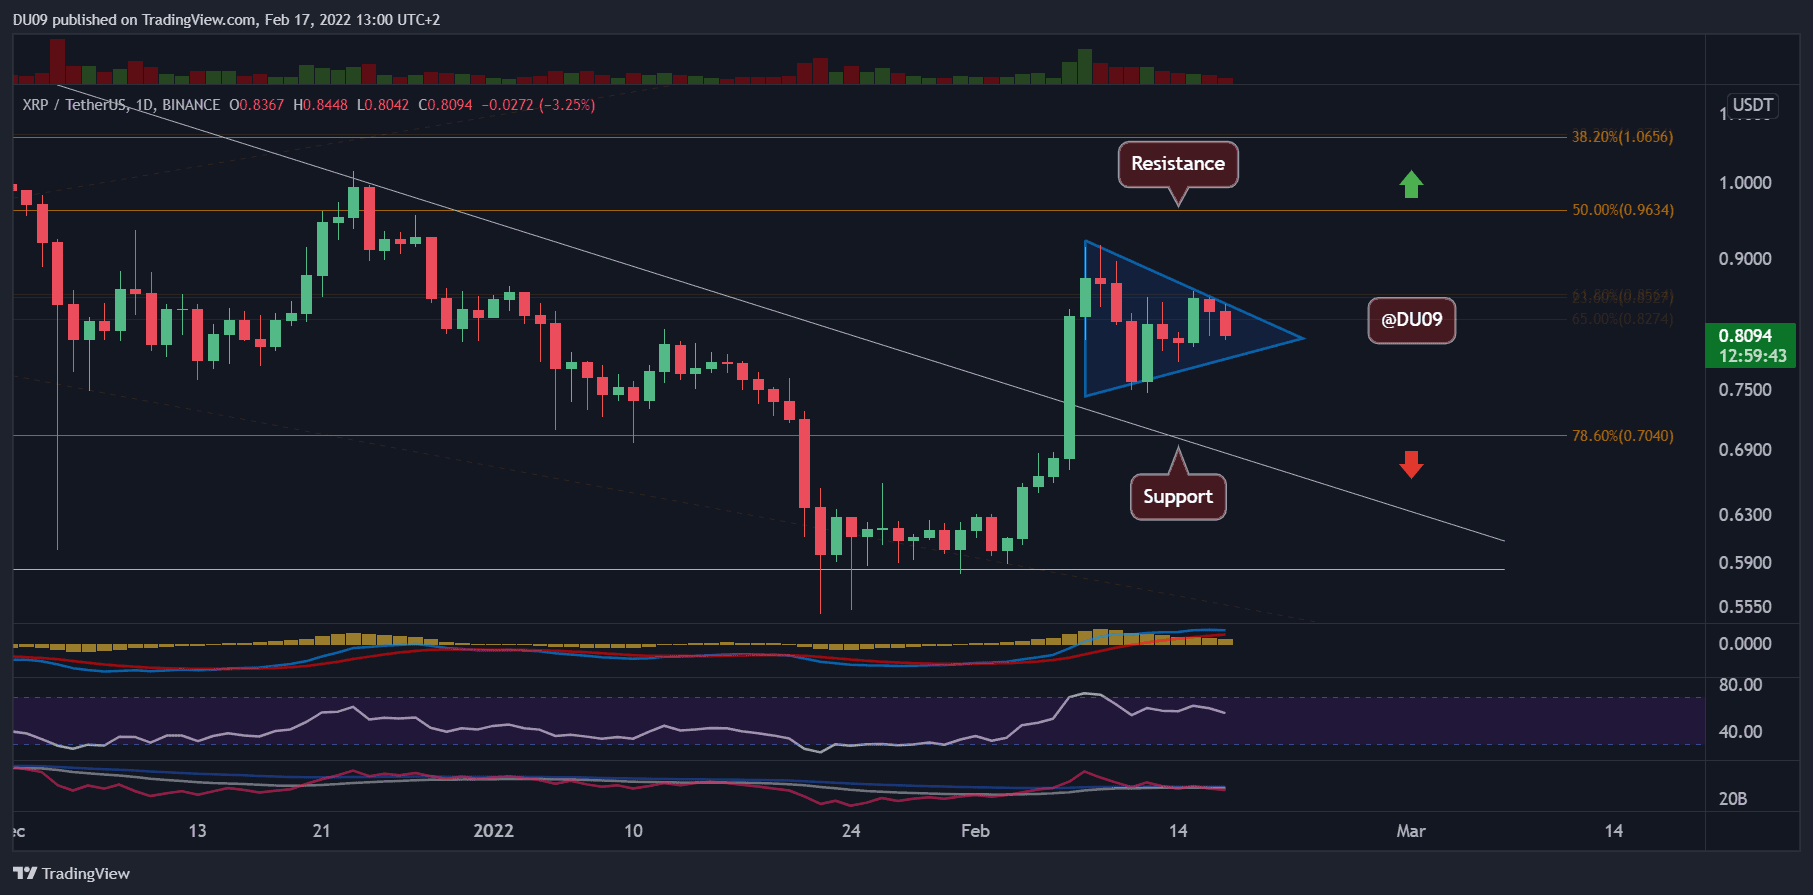
Trading Volume: The volume continues to decline as the consolidation progresses. However, once the price breaks away from the pennant, the volume may return.
RSI: The daily RSI has made a lower high and is falling, this suggests a possible bearish scenario in the near term.
MACD: Similar to the volume, the MACD histogram has been falling, making lower highs since the consolidation started. While the MACD remains bullish, the moving averages are falling and may complete a bearish cross if XRP breaks below the pennant.
Bias
The current XRP bias is neutral. Price is likely to move sideways in the near term.
Short-Term Prediction for XRP Price
XRP lost its bullish momentum and is likely to continue its consolidation within the current range. Price is expected to break away from the pennant, which will likely indicate where XRP is headed next.