Key Support level: %excerpt%.70, %excerpt%.58 Key Resistance levels: %excerpt%.86 After a strong bounce, XRP managed to get back above the key support at %excerpt%.70. This is a good sign and shows buyers are keen to scoop the cryptocurrency at a discount. Now, XRP seems keen to move higher again. If buy pressure increases, it could reach the resistance at %excerpt%.86. Chart by TradingViewTechnical Indicators Trading Volume: The volume is quickly falling. This could be a sign that buyers are getting exhausted. For now, the key support has held well. RSI: The daily RSI is moving higher with higher lows – this is a bullish signal. MACD: The daily MACD is bearish but is now quickly approaching a possible crossover to the positive side. If the current momentum maintains, XRP may reach the key resistance soon.
Topics:
Duo Nine considers the following as important: Ripple (XRP) Price, XRP Analysis, xrpbtc, xrpusd
This could be interesting, too:
Jordan Lyanchev writes Ripple’s (XRP) Surge to Triggers Over Million in Short Liquidations
Jordan Lyanchev writes Trump Confirms Work on Strategic Crypto Reserve: XRP, ADA, SOL Included
Dimitar Dzhondzhorov writes Is a Major Ripple v. SEC Lawsuit Development Expected This Week? Here’s Why
Mandy Williams writes Ripple Releases Institutional DeFi Roadmap for XRP Ledger in 2025
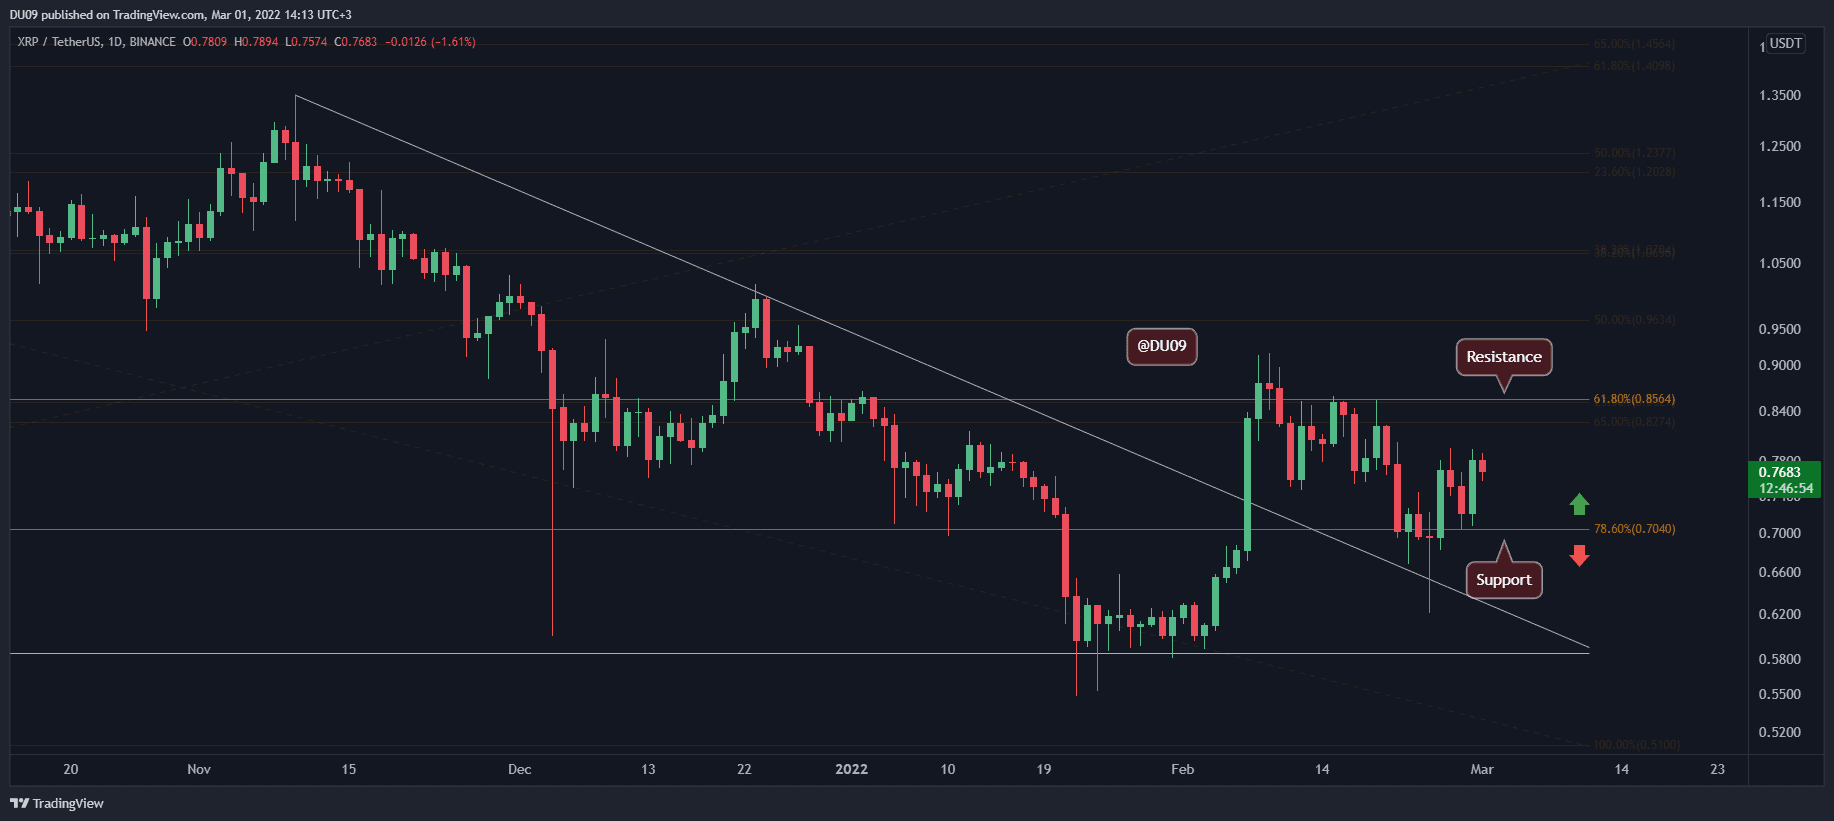
Key Support level: $0.70, $0.58
Key Resistance levels: $0.86
After a strong bounce, XRP managed to get back above the key support at $0.70. This is a good sign and shows buyers are keen to scoop the cryptocurrency at a discount. Now, XRP seems keen to move higher again. If buy pressure increases, it could reach the resistance at $0.86.
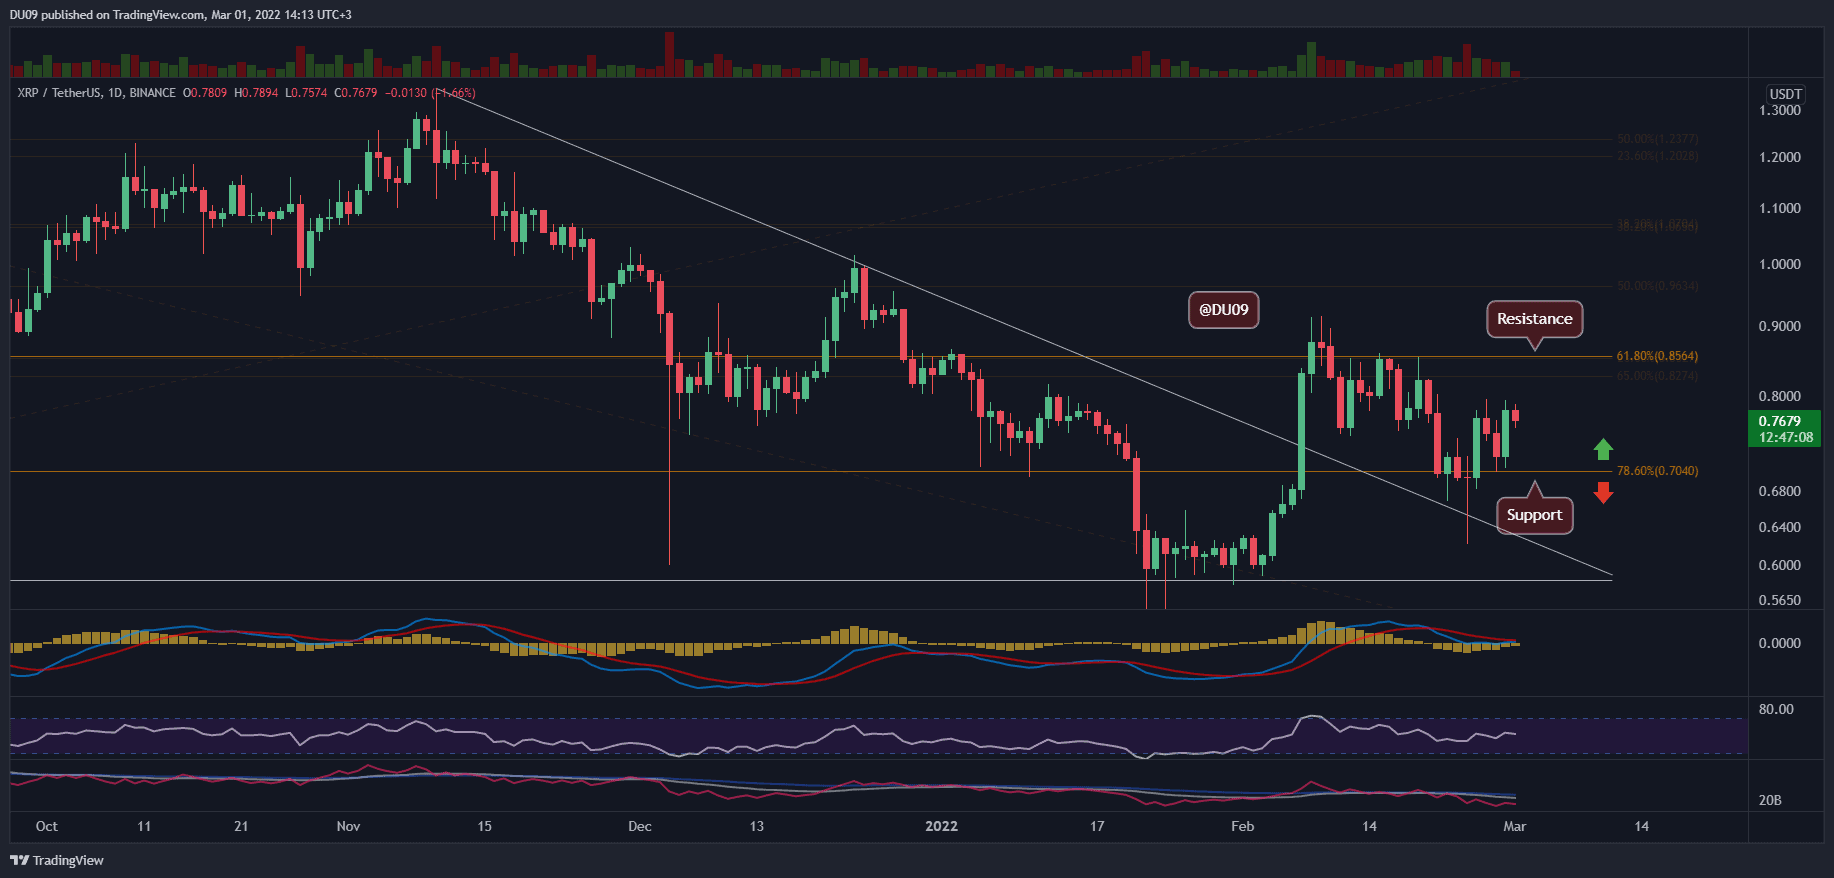
Technical Indicators
Trading Volume: The volume is quickly falling. This could be a sign that buyers are getting exhausted. For now, the key support has held well.
RSI: The daily RSI is moving higher with higher lows – this is a bullish signal.
MACD: The daily MACD is bearish but is now quickly approaching a possible crossover to the positive side. If the current momentum maintains, XRP may reach the key resistance soon.
Bias
The current bias is neutral. The price has been consolidating between the key levels.
Short-Term Prediction for XRP Price
XRP seems to consolidate above the key support at $0.70 and may be preparing a possible test of the resistance at $0.86. There are some early bullish signals, but XRP needs more momentum to confirm this and turn the bias bullish.