Despite the listing on Robinhood, SHIB has lost most of its recent gains. Key Support level: %excerpt%.000023 Key Resistance level: %excerpt%.000028 The rally last week, which was following the news, could not hold SHIB’s price above the key resistance at %excerpt%.000028. Since then, SHIB has dropped back toward the critical support at %excerpt%.000023, where it found a local bottom. However, the overall price action is turning bearish despite some attempts from buyers to change this. Chart by TradingViewTechnical Indicators Trading Volume: The volume of the past days was low, without sufficient momentum to push SHIB away from its current range. RSI: The daily RSI remains around the 50 points level, but this can quickly change if SHIB breaks below the critical support. MACD: The daily MACD did a
Topics:
Duo Nine considers the following as important: Price Analysis, Shiba Inu (SHIB), SHIBBTC, SHIBUSD
This could be interesting, too:
Jordan Lyanchev writes Shiba Inu Price Forecasts: Another 50% Crash or 420% Rally Ahead for SHIB?
Dimitar Dzhondzhorov writes This Trader Made Over Million by Selling Shiba Inu (SHIB) Holdings: Details
Dimitar Dzhondzhorov writes Shiba Inu (SHIB) Drops by 15% in 2 Weeks: These Factors Suggest Extended Correction
Jordan Lyanchev writes Meme Coin Bloodbath: BONK, FLOKI, WIF, SHIB, and DOGE Crash by Double Digits
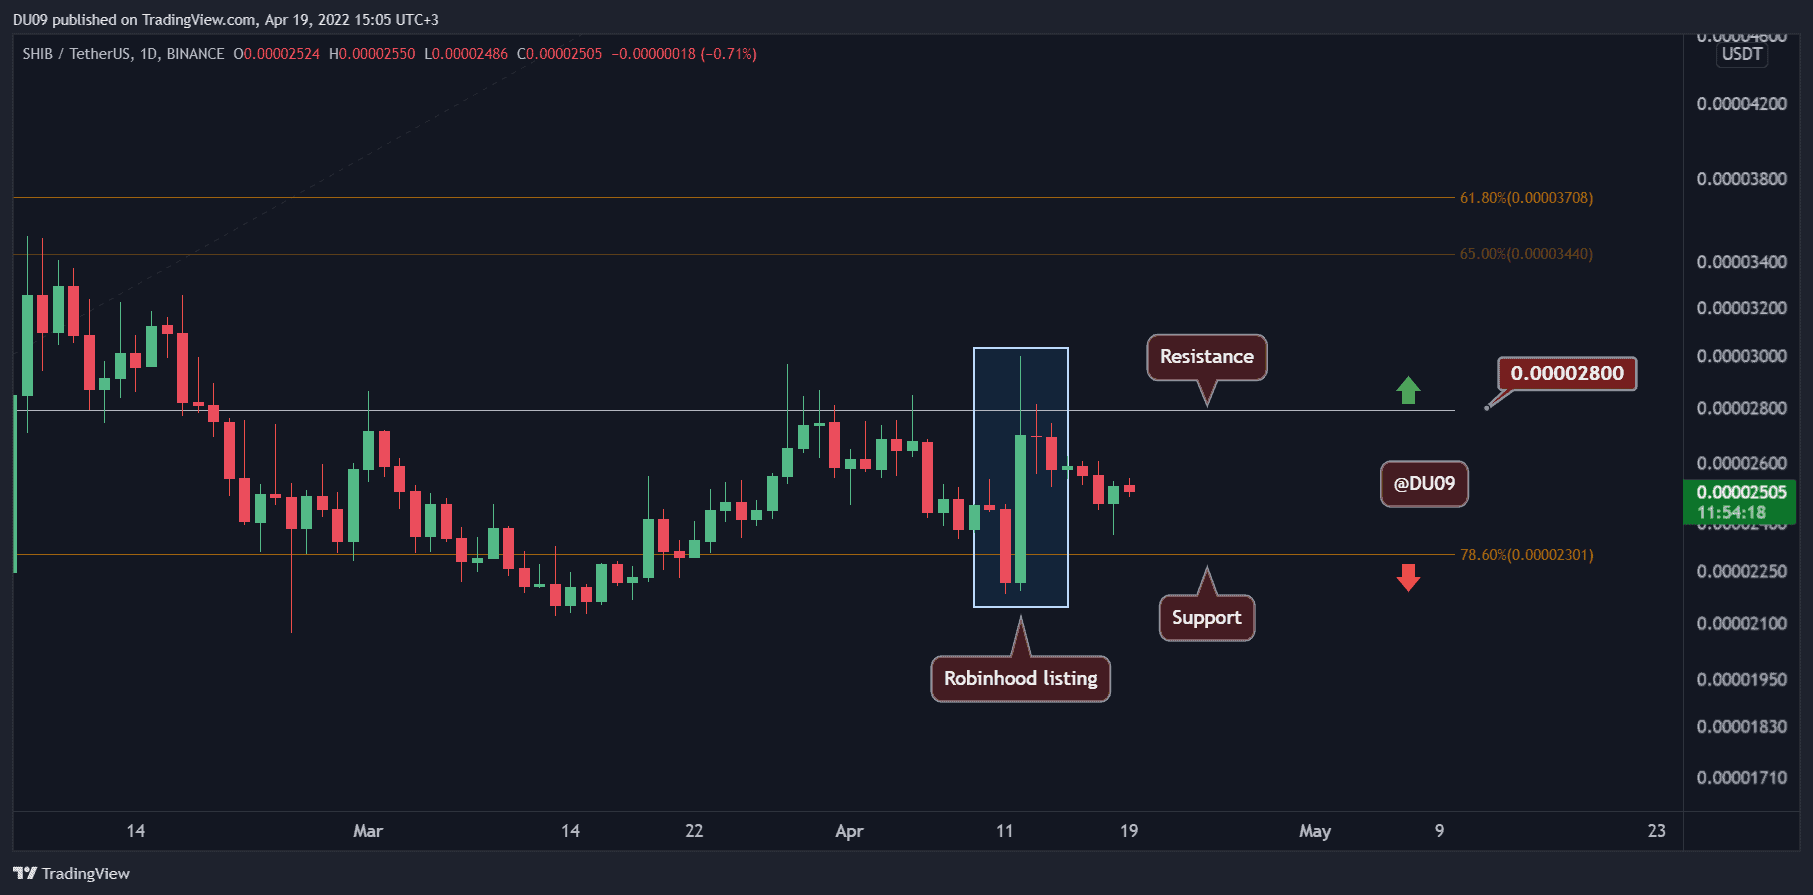
Despite the listing on Robinhood, SHIB has lost most of its recent gains.
Key Support level: $0.000023
Key Resistance level: $0.000028
The rally last week, which was following the news, could not hold SHIB’s price above the key resistance at $0.000028.
Since then, SHIB has dropped back toward the critical support at $0.000023, where it found a local bottom. However, the overall price action is turning bearish despite some attempts from buyers to change this.
Technical Indicators
Trading Volume: The volume of the past days was low, without sufficient momentum to push SHIB away from its current range.
RSI: The daily RSI remains around the 50 points level, but this can quickly change if SHIB breaks below the critical support.
MACD: The daily MACD did a bullish cross during the news about Robinhood, but now it crossed back and turned bearish again.

Bias
The bias on SHIB is bearish.
Short-Term Prediction for SHIB Price
SHIB appears to be unable to leave the price range that it was trading at, back in March. Now, the price is quickly approaching the key support at $0.000023.