Since the collapse of FTX, Solana has been moving sideways, consolidating above . But now the price action is giving hints that this may change soon, and interestingly, the positivity came a day after SBF was arrested. Solana Price Analysis Key Support levels: .5 Key Resistance levels: .5 Solana found good support at , and the price never went under this key level since November. Buyers now appear eager to take SOL higher and challenge the resistance at . While the current momentum remains flat, this can easily change. Chart by TradingViewTechnical Indicators Trading Volume: The buying volume picked up yesterday and has closed in green which could lead to continuation. RSI: The daily RSI is moving higher with higher lows and higher highs. This is promising
Topics:
Duo Nine considers the following as important: Price Analysis, Solana (SOL) Price, SOLBTC, SOLUSD
This could be interesting, too:
Jordan Lyanchev writes Trump Confirms Work on Strategic Crypto Reserve: XRP, ADA, SOL Included
Chayanika Deka writes Bitcoin Ends Week with 5M Inflows as Multi-Asset Products Face 1M in Losses
Wayne Jones writes Solana Surpasses Ethereum as Top Ecosystem for New Developers in 2024: Report
Jordan Lyanchev writes Solana Whales Begin Accumulation Spree Amid Predictions of SOL at 0
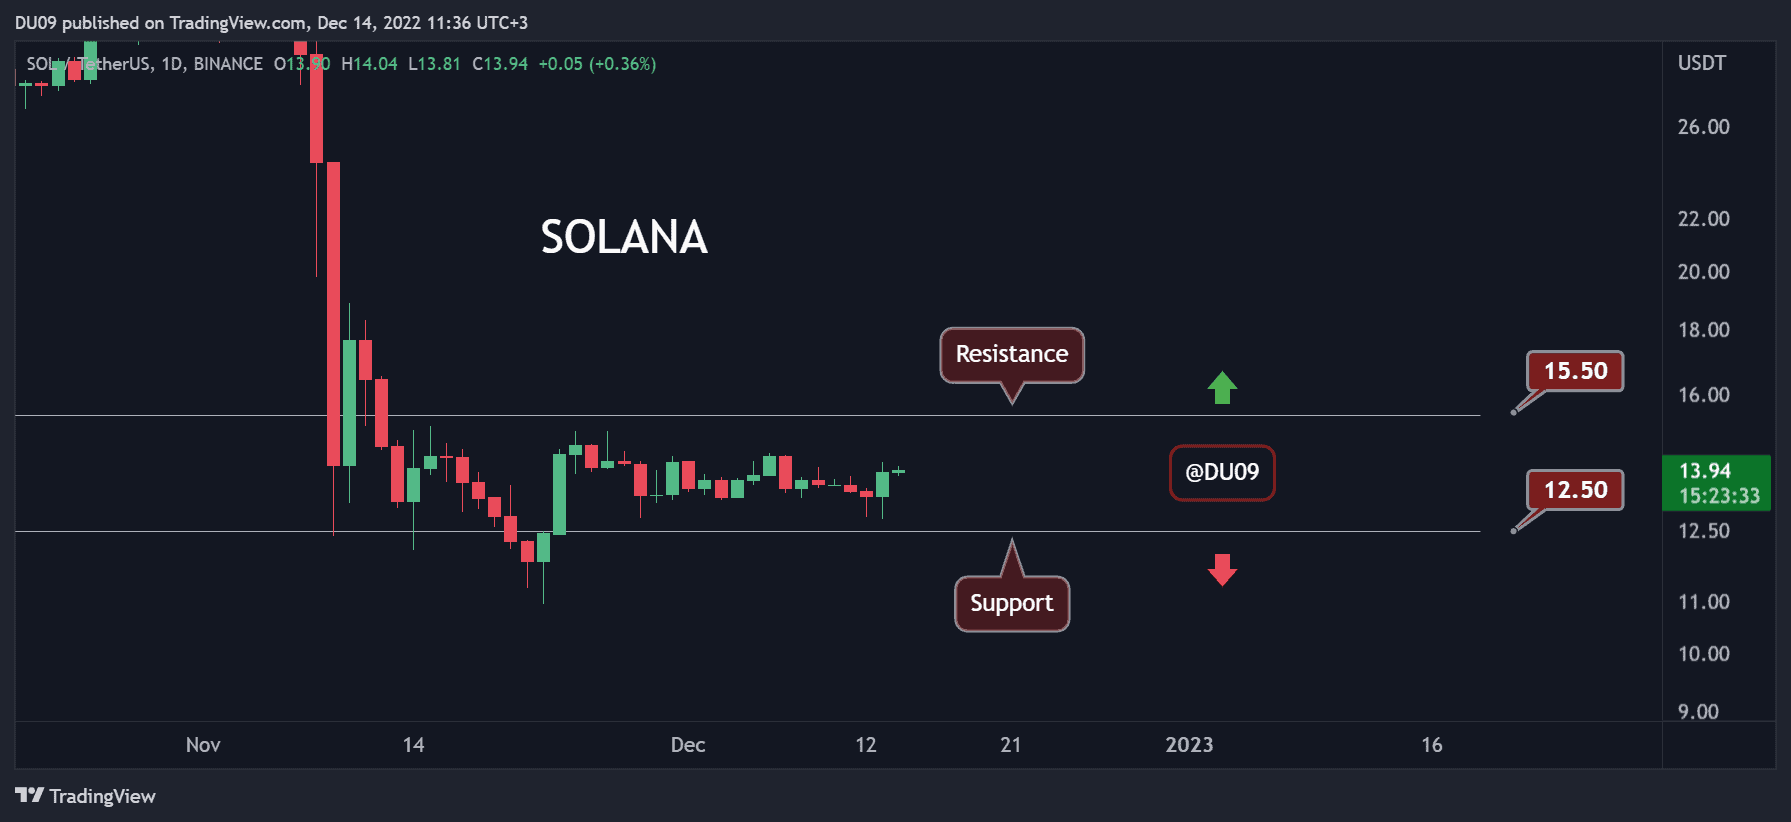
Since the collapse of FTX, Solana has been moving sideways, consolidating above $12. But now the price action is giving hints that this may change soon, and interestingly, the positivity came a day after SBF was arrested.
Solana Price Analysis
Key Support levels: $12.5
Key Resistance levels: $15.5
Solana found good support at $12, and the price never went under this key level since November. Buyers now appear eager to take SOL higher and challenge the resistance at $15. While the current momentum remains flat, this can easily change.
Technical Indicators
Trading Volume: The buying volume picked up yesterday and has closed in green which could lead to continuation.
RSI: The daily RSI is moving higher with higher lows and higher highs. This is promising and bullish.
MACD: The daily MACD is bullish, but the momentum remains flat, as indicated by the histogram. If the buying pressure picks up, this could soon change to favor bulls.

Bias
The bias for SOL is neutral. To turn bullish, buyers would have to take Solana above $15.
Short-Term Prediction for SOL Price
With the sellers exhausted, Solana seems to have only one way to go, which is up. Even if this materializes, bears may still return at the $15 key resistance.