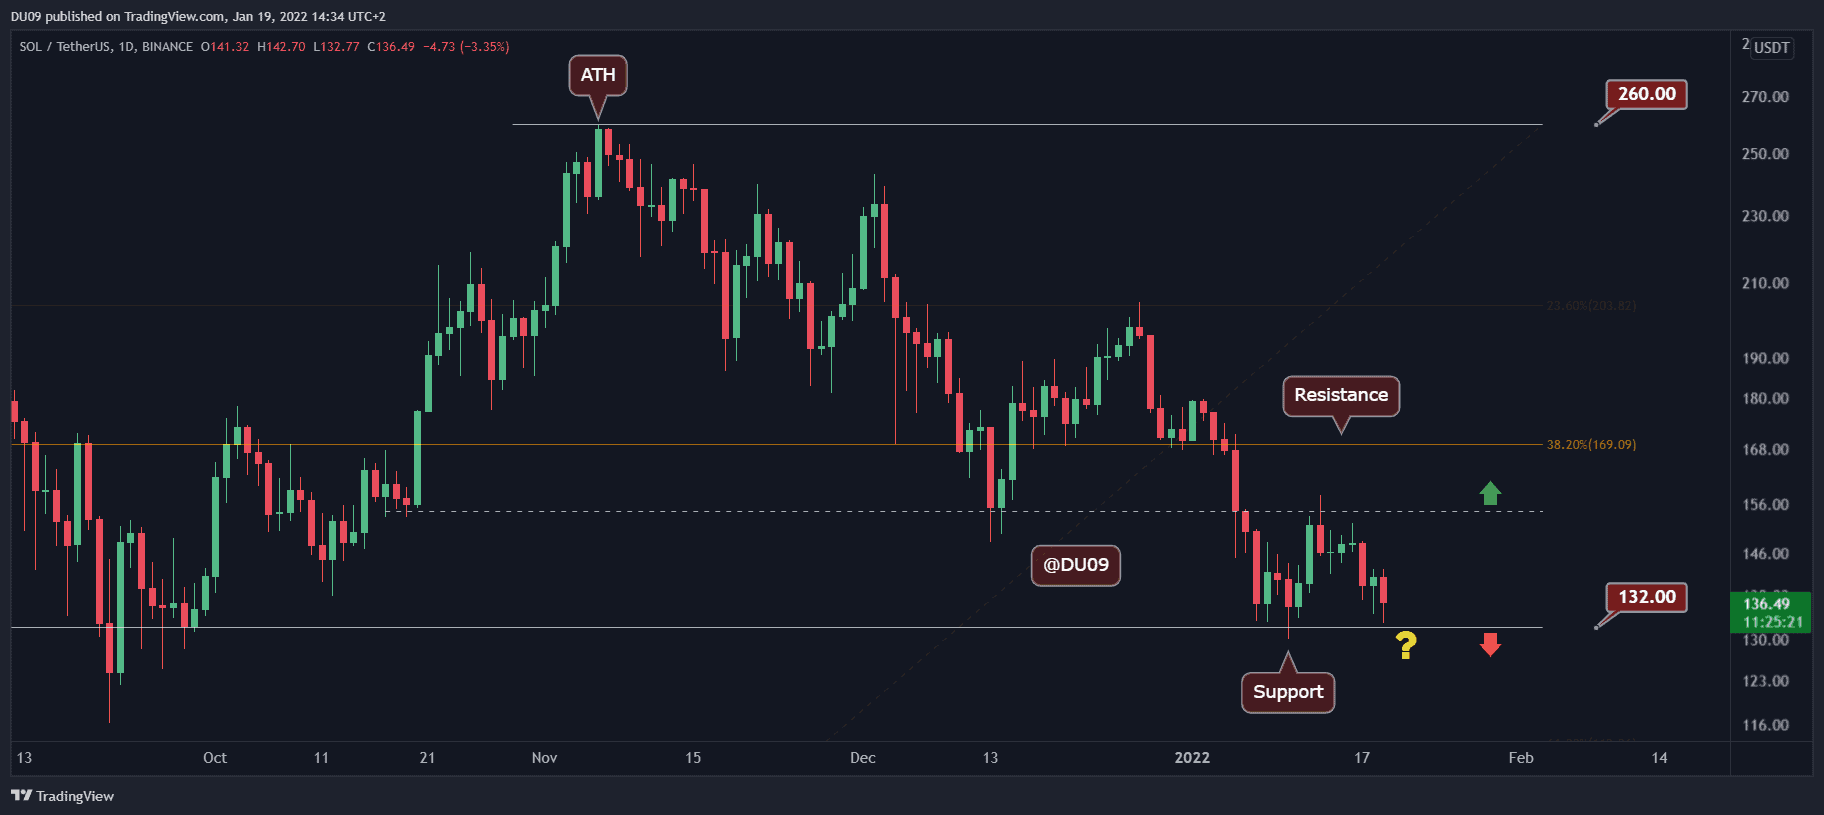
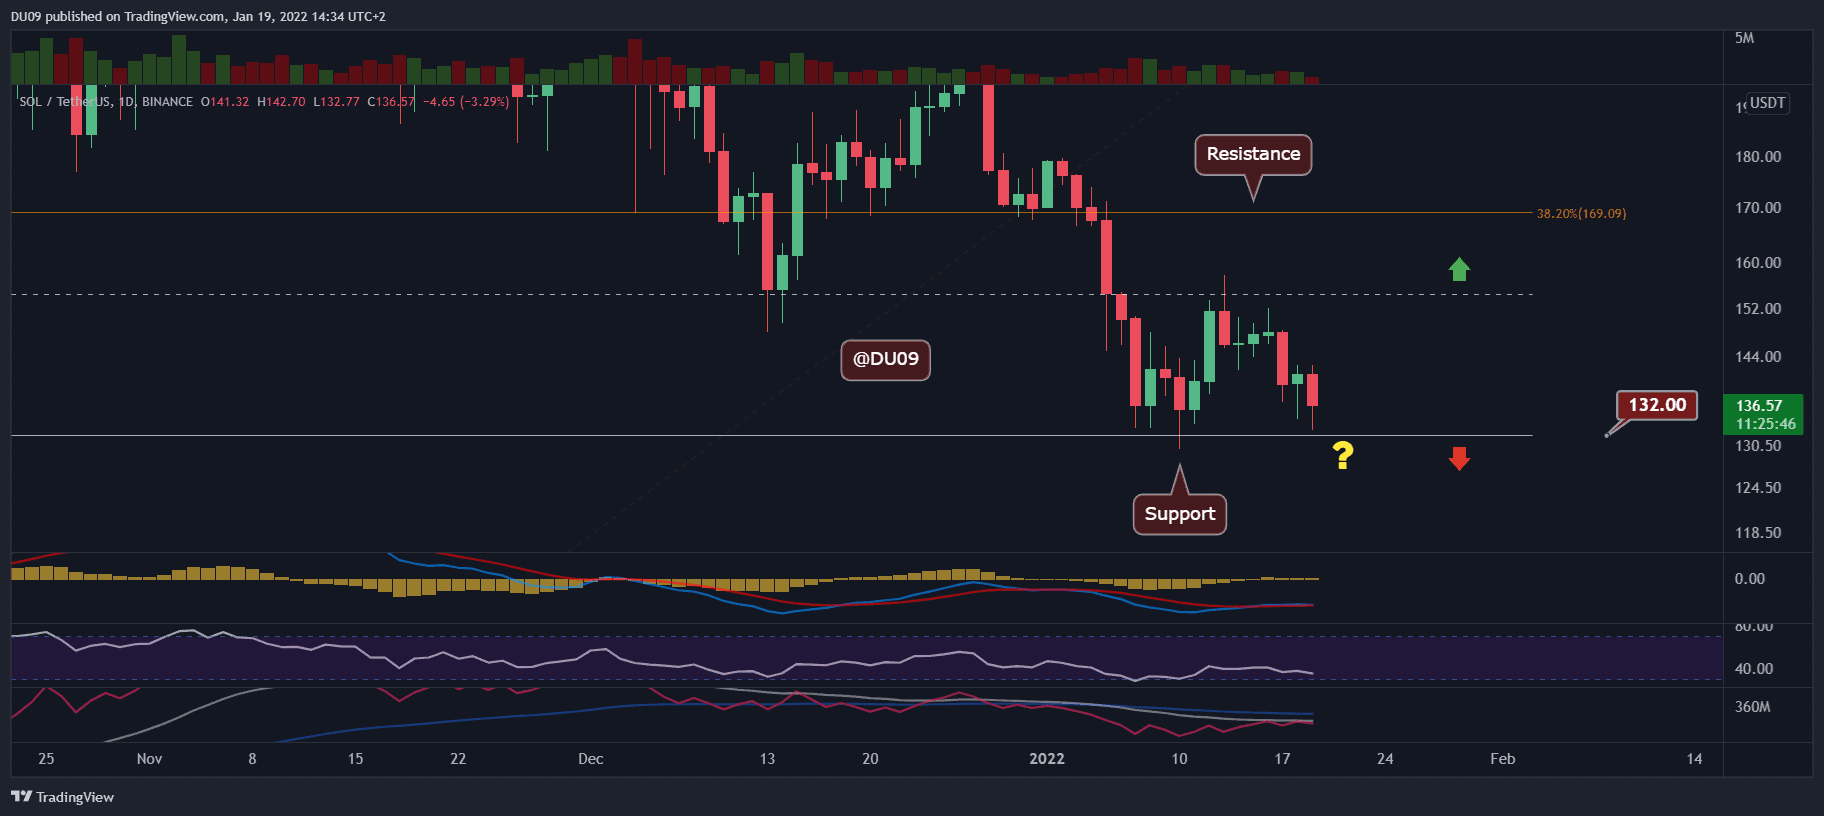
Key Support levels: 0 Key Resistance level: 5, 0 SOL fell back to the critical support at 0 in the past few days, failing to maintain its rally from last week. Buyers might be interested at current price levels since the last time it visited this key level, bulls came in force and pushed SOL into a relief rally. The resistance currently sits at 5. This level represents the biggest challenge for any possible rally. Chart by TradingViewTechnical Indicators Trading Volume: The volume decreased as the price fell, which does not favor the bears. Therefore, buyers may have a great chance to reverse the current price action back into an uptrend. RSI: The RSI on the daily timeframe remains bearish with lower highs and lower lows. There are no signs yet of a possible
Topics:
Duo Nine considers the following as important: Price Analysis, Solana (SOL) Price, SOLBTC, SOLUSD
This could be interesting, too:
Jordan Lyanchev writes Trump Confirms Work on Strategic Crypto Reserve: XRP, ADA, SOL Included
Chayanika Deka writes Bitcoin Ends Week with 5M Inflows as Multi-Asset Products Face 1M in Losses
Wayne Jones writes Solana Surpasses Ethereum as Top Ecosystem for New Developers in 2024: Report
Jordan Lyanchev writes Solana Whales Begin Accumulation Spree Amid Predictions of SOL at 0
Key Support levels: $130
Key Resistance level: $155, $170
SOL fell back to the critical support at $130 in the past few days, failing to maintain its rally from last week. Buyers might be interested at current price levels since the last time it visited this key level, bulls came in force and pushed SOL into a relief rally.
The resistance currently sits at $155. This level represents the biggest challenge for any possible rally.
Technical Indicators
Trading Volume: The volume decreased as the price fell, which does not favor the bears. Therefore, buyers may have a great chance to reverse the current price action back into an uptrend.
RSI: The RSI on the daily timeframe remains bearish with lower highs and lower lows. There are no signs yet of a possible reversal.
MACD: While the daily MACD is on the positive side, there was barely any momentum to reflect this in terms of price, and now the moving averages are closing in for a bearish crossover. If the buyers fail to step in soon, then it is unlikely for the downtrend to stop.
Bias
The current bias is bearish. Nevertheless, the bulls have a good shot to push SOL higher from the key support level as sellers seem indecisive considering the volume profile.
Short-Term Prediction for SOL Price
SOL was unable to push above the key resistance at $155 last week, and the price suffered. Now, it is back on the key support at $130, and it’s possible for the bulls to step up once there. It is likely that SOL will be very much influenced by the market leaders in the face of BTC and ETH in its next move.