For nearly two weeks, Ripple has been below its static level at %excerpt%.45. The bulls attempted to push the price above it several times, but so far, they have failed. Technical Analysis By Grizzly The Daily Chart On the daily timeframe, XRP saw a 37% recovery below the static level (in blue) after the bulls managed to defend the horizontal support at %excerpt%.33 (in green). The MA 20D (in white) has come down to this important level and acts as a price barrier. The cryptocurrency has not even been able to touch the dynamic level, suggesting this is a significant challenge for the bulls. It is important to remember that even if the price hits this level again, it is still too early to think about a reversal of the trend because the MA 20D is only the first major obstacle to overcome.
Topics:
CryptoVizArt considers the following as important: Ripple (XRP) Price, XRP Analysis, xrpbtc, xrpusd
This could be interesting, too:
Jordan Lyanchev writes Ripple’s (XRP) Surge to Triggers Over Million in Short Liquidations
Jordan Lyanchev writes Trump Confirms Work on Strategic Crypto Reserve: XRP, ADA, SOL Included
Dimitar Dzhondzhorov writes Is a Major Ripple v. SEC Lawsuit Development Expected This Week? Here’s Why
Mandy Williams writes Ripple Releases Institutional DeFi Roadmap for XRP Ledger in 2025
For nearly two weeks, Ripple has been below its static level at $0.45. The bulls attempted to push the price above it several times, but so far, they have failed.
Technical Analysis
By Grizzly
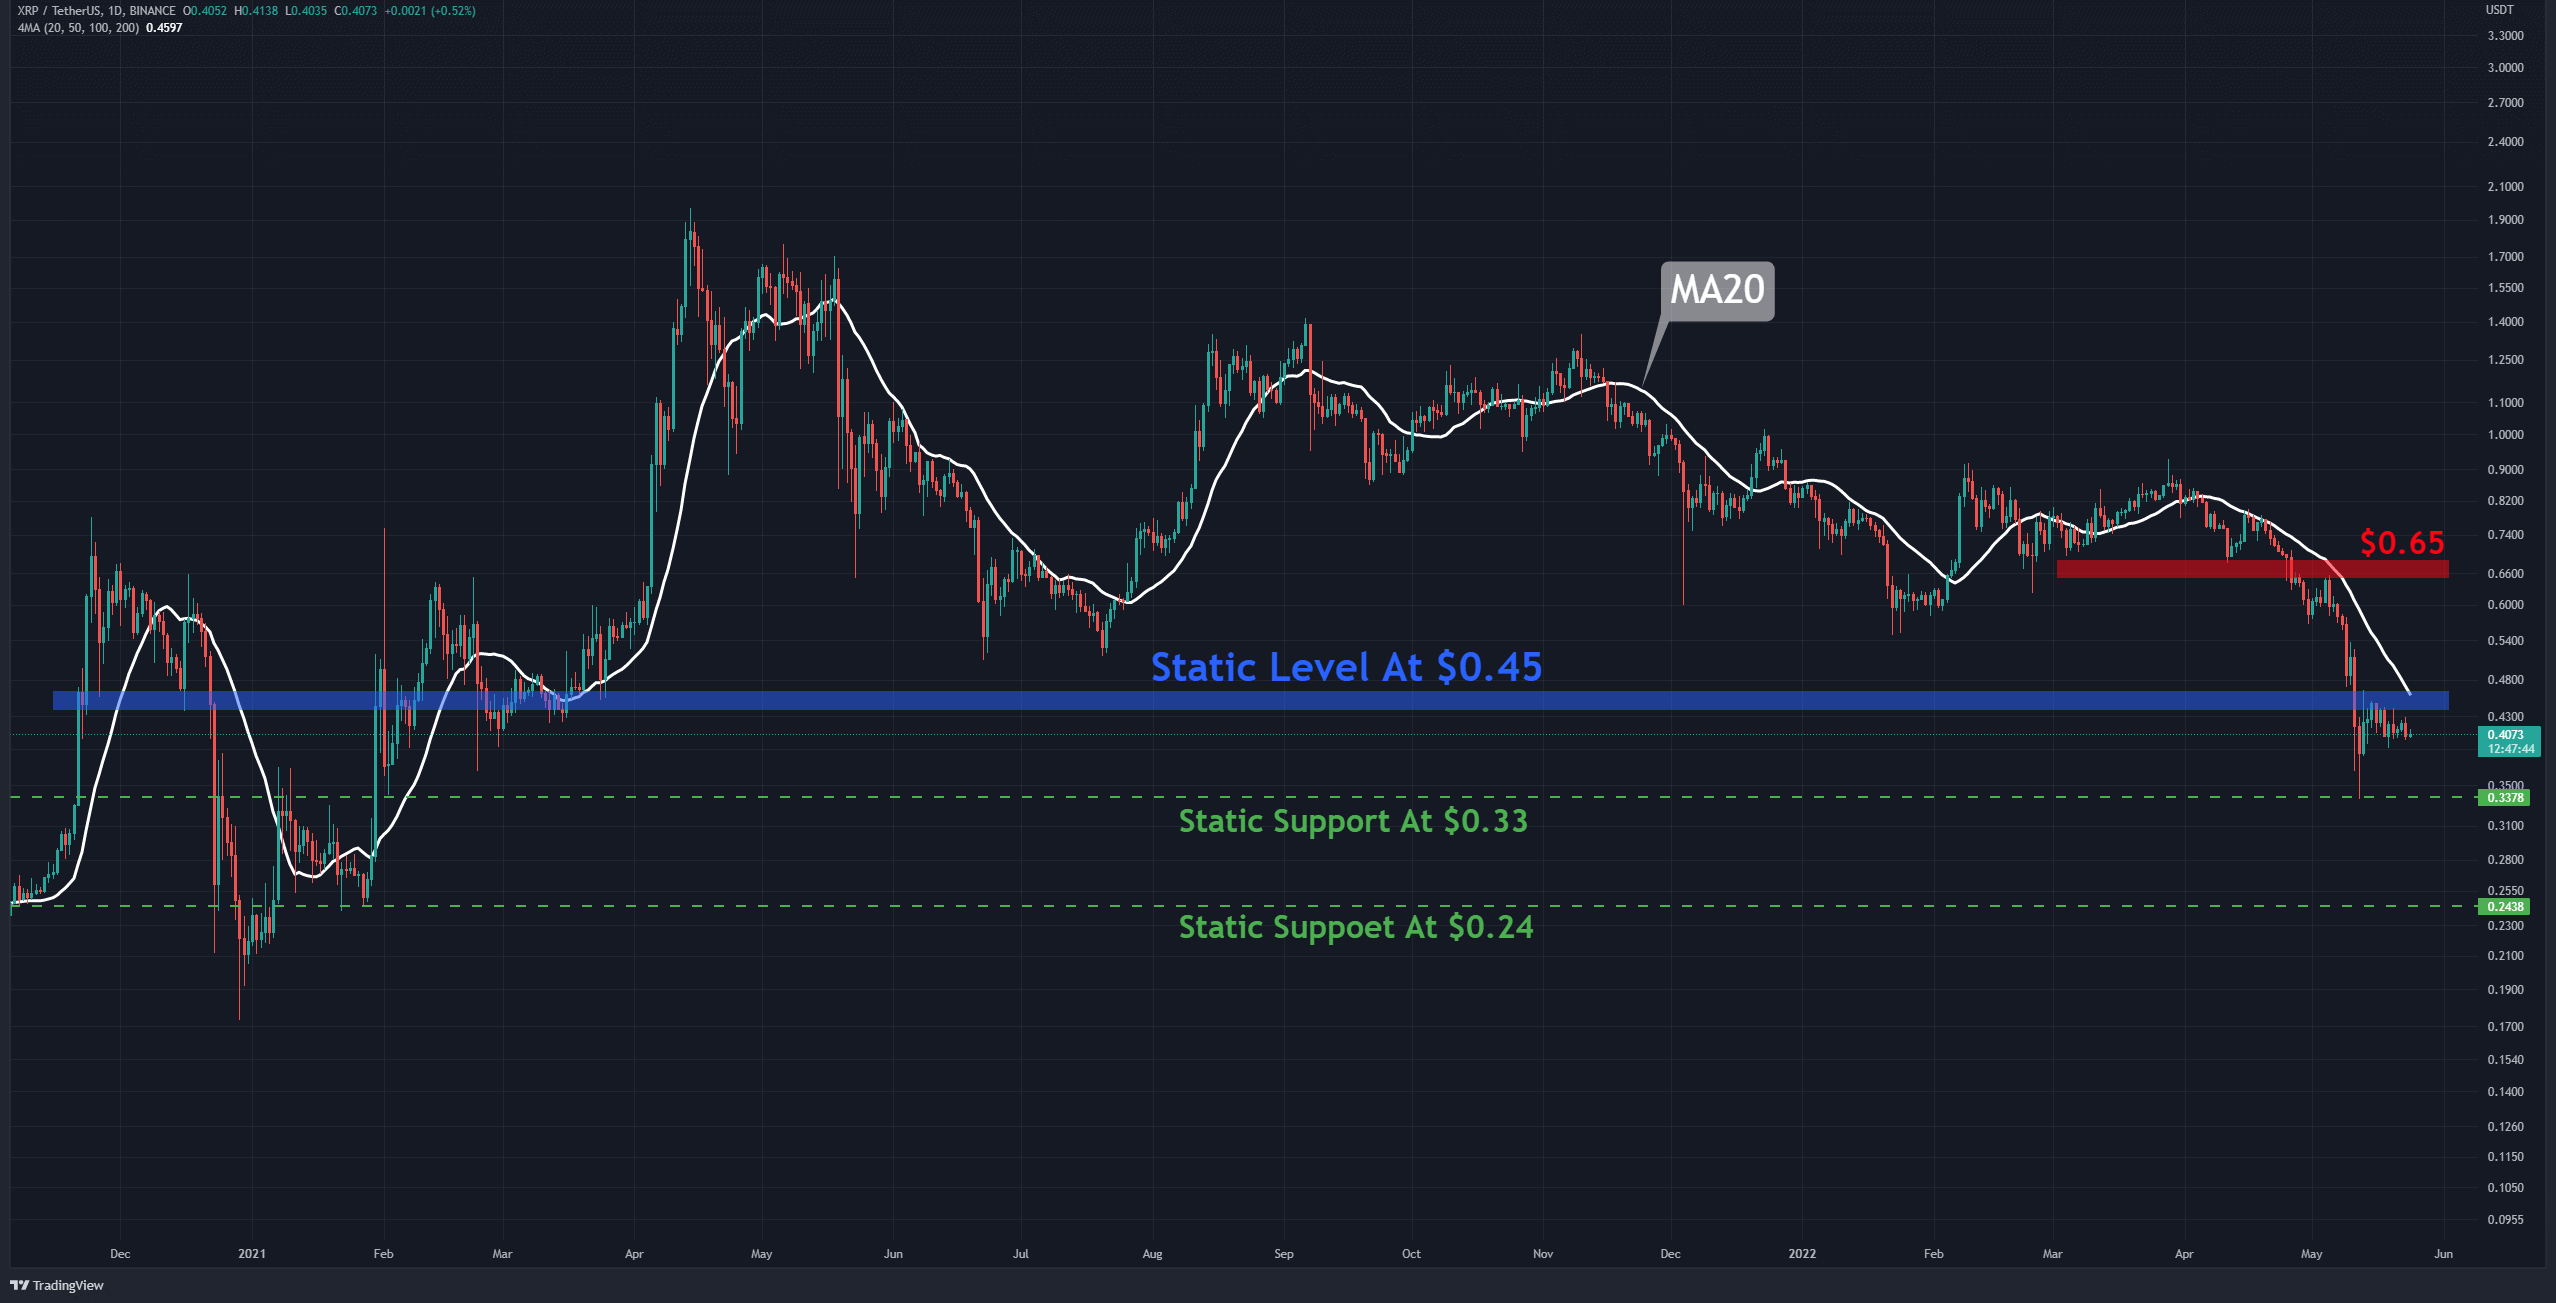
The Daily Chart
On the daily timeframe, XRP saw a 37% recovery below the static level (in blue) after the bulls managed to defend the horizontal support at $0.33 (in green).
The MA 20D (in white) has come down to this important level and acts as a price barrier. The cryptocurrency has not even been able to touch the dynamic level, suggesting this is a significant challenge for the bulls. It is important to remember that even if the price hits this level again, it is still too early to think about a reversal of the trend because the MA 20D is only the first major obstacle to overcome. In order to see a trend reversal, XRP should return to the top of the horizontal resistance at $0.65 and form a higher high.
Suppose the bears remain in control of the market. In that case, the price is likely to retest lower levels before any potential convincing bounce could take place.
Key Support Levels: $0.33 & $0.24 & $0.17
Key Resistance Levels: $0.45 & $0.50 & $0.65
Moving Averages:
MA20: $0.45
MA50: $0.60
MA100: $0.69
MA200: $0.78
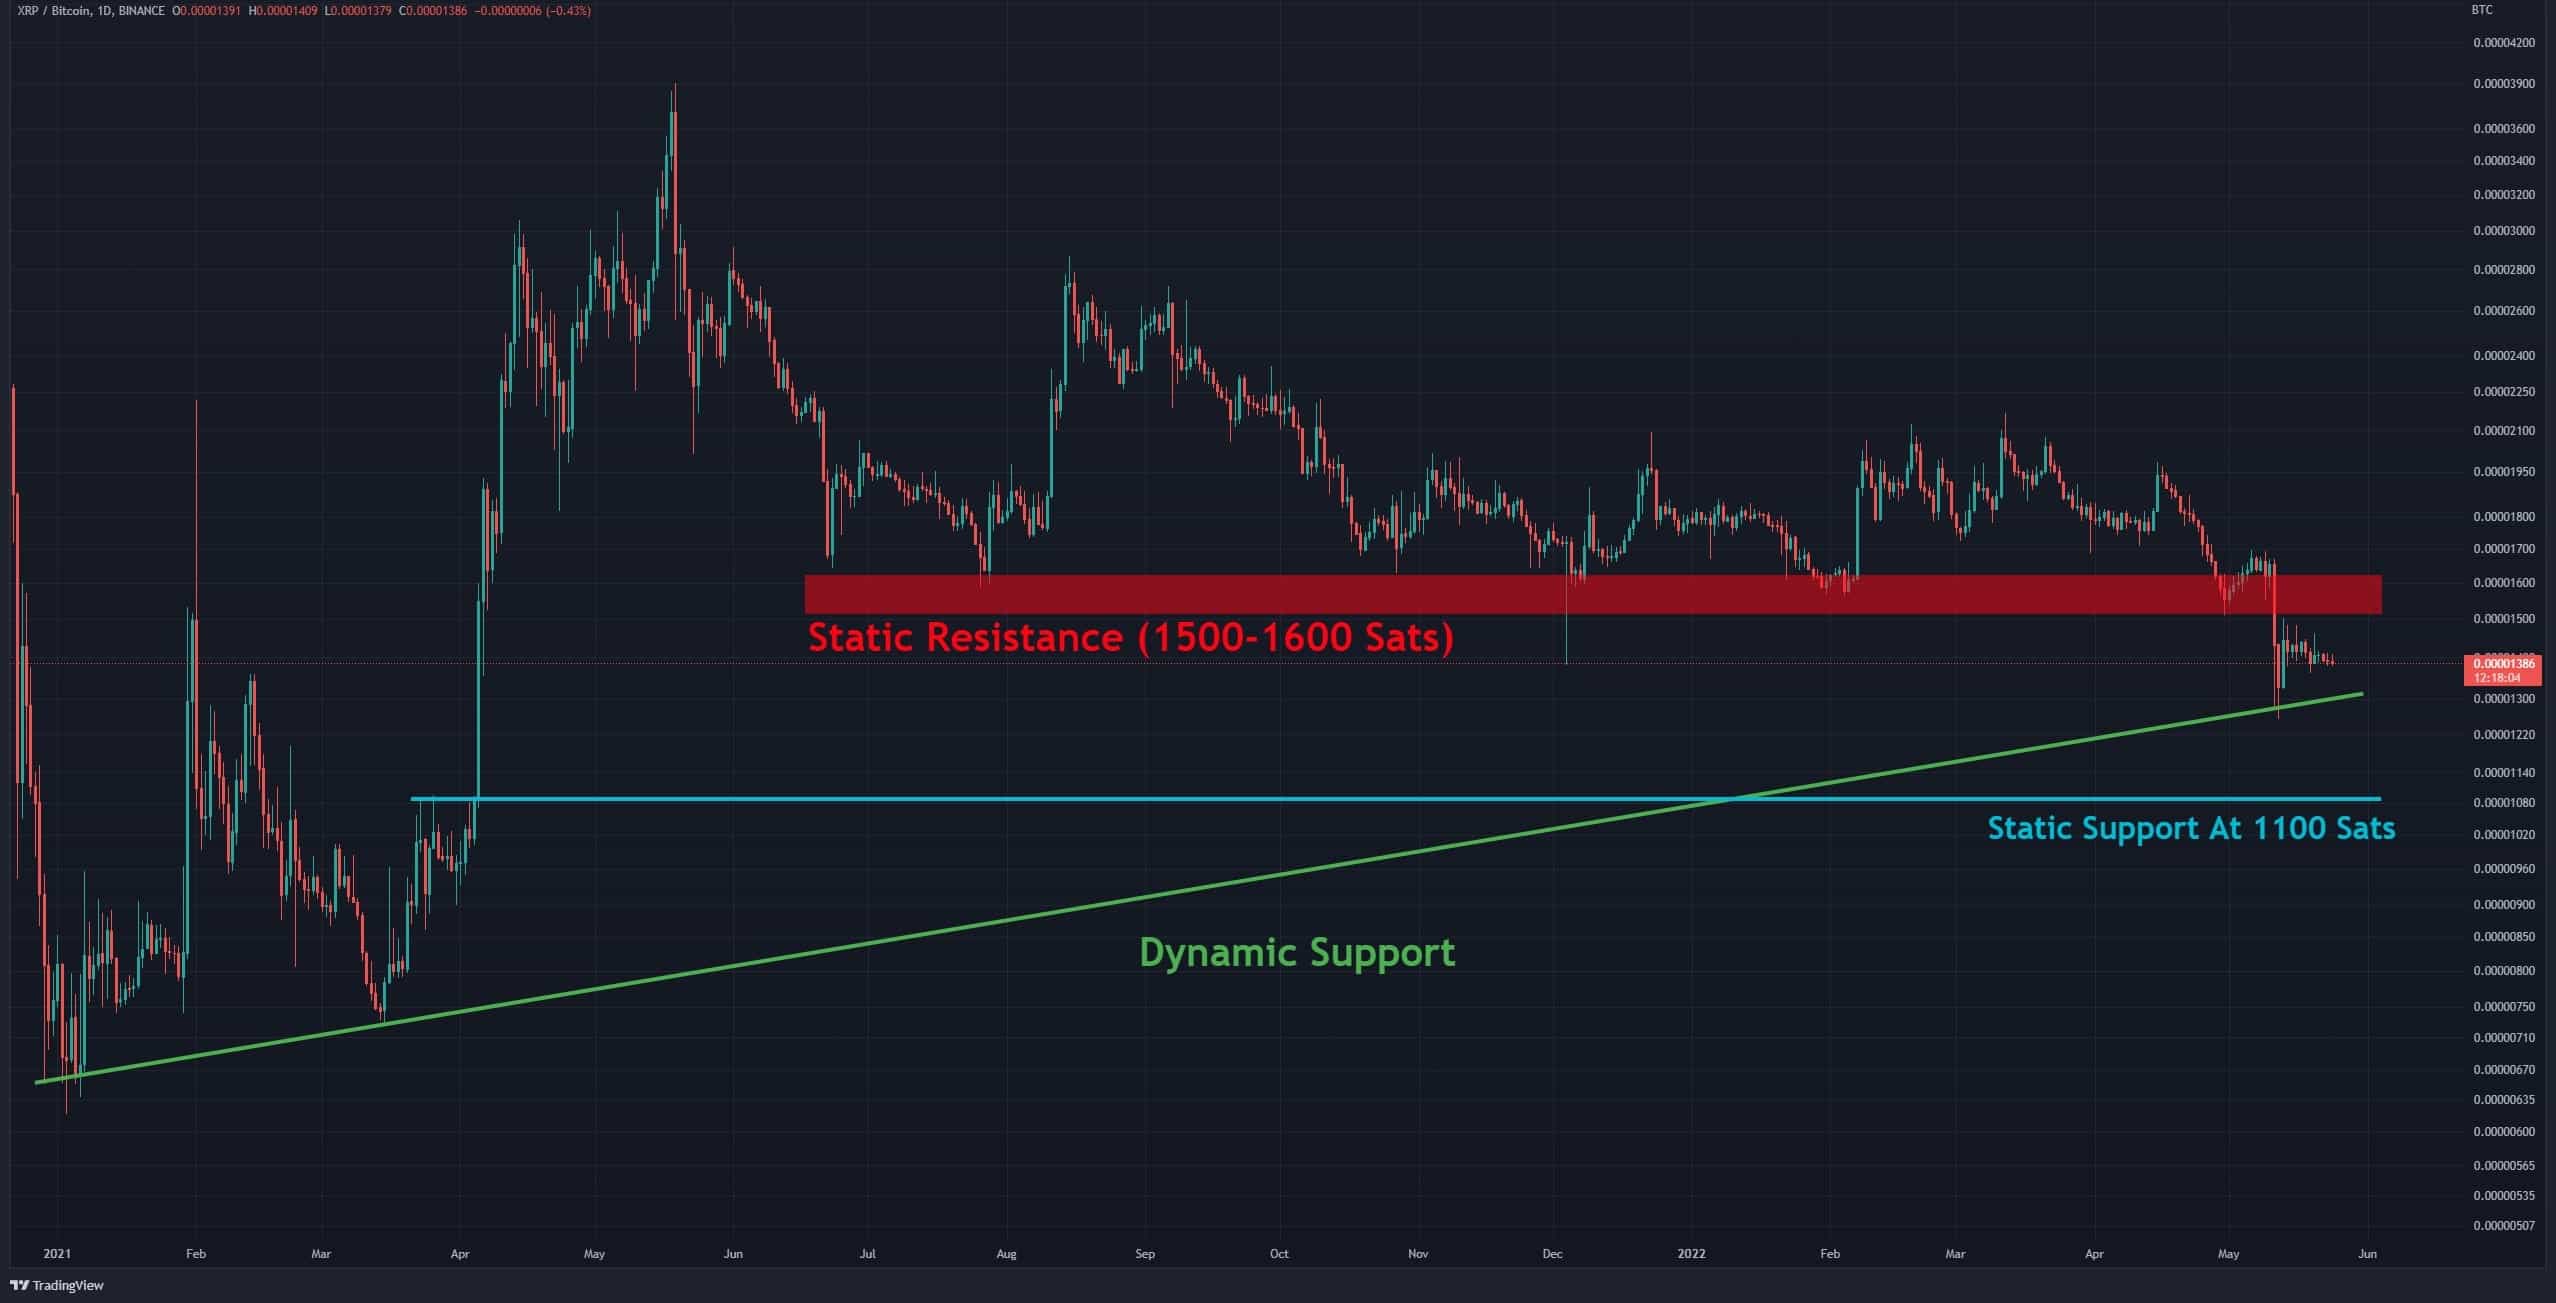
The XRP/BTC chart
Against BTC, Ripple saw its price fluctuate below the static level (in red). The dynamic support (in green) has been defended by the bulls so far.
The buyers should be able to push the price above the red resistance zone to reduce the downward momentum. After that, the chart might be under consideration for a reevaluation more confidently to examine whether or not there’s potential for a trend reversal. However, there is no sign that the bulls have gained control yet.
Given the bearish bias in the overall market, it seems more likely that the bulls will fail to defend dynamic support, and the bears will push the price towards static support at 1100 Sats.