ADA failed to sustain a rally and break the key resistance. Now, the price is dangerously close to a critical support. Key Support levels: %excerpt%.50, %excerpt%.40 Key Resistance levels: %excerpt%.60, %excerpt%.75 ADA attempted to rally yesterday, but the price was quickly pushed back to the key support at %excerpt%.50. Should this critical level fall, then the cryptocurrency could go all the way down to %excerpt%.40. The important resistance sits at %excerpt%.60, and Cardano only managed to test this level once when it was sharply rejected. Chart by TradingViewTechnical Indicators Trading Volume: The volume is absent. There is simply no momentum behind the price action, and the best ADA could do is move sideways. This is a sign of weakness in the market. RSI: The daily RSI made a higher low and higher high, but
Topics:
Duo Nine considers the following as important: ADABTC, ADAUSD, Cardano (ADA) Price, Price Analysis
This could be interesting, too:
Jordan Lyanchev writes Cardano (ADA) Surpasses Dogecoin After 55% Surge
Jordan Lyanchev writes Trump Confirms Work on Strategic Crypto Reserve: XRP, ADA, SOL Included
Dimitar Dzhondzhorov writes Millions of ADA Sold by Cardano Whales During Market Crash – Will the Decline Continue?
Jordan Lyanchev writes Here’s How Cardano’s 17% Weekly Correction Can Help ADA Hit This Cycle: Analyst
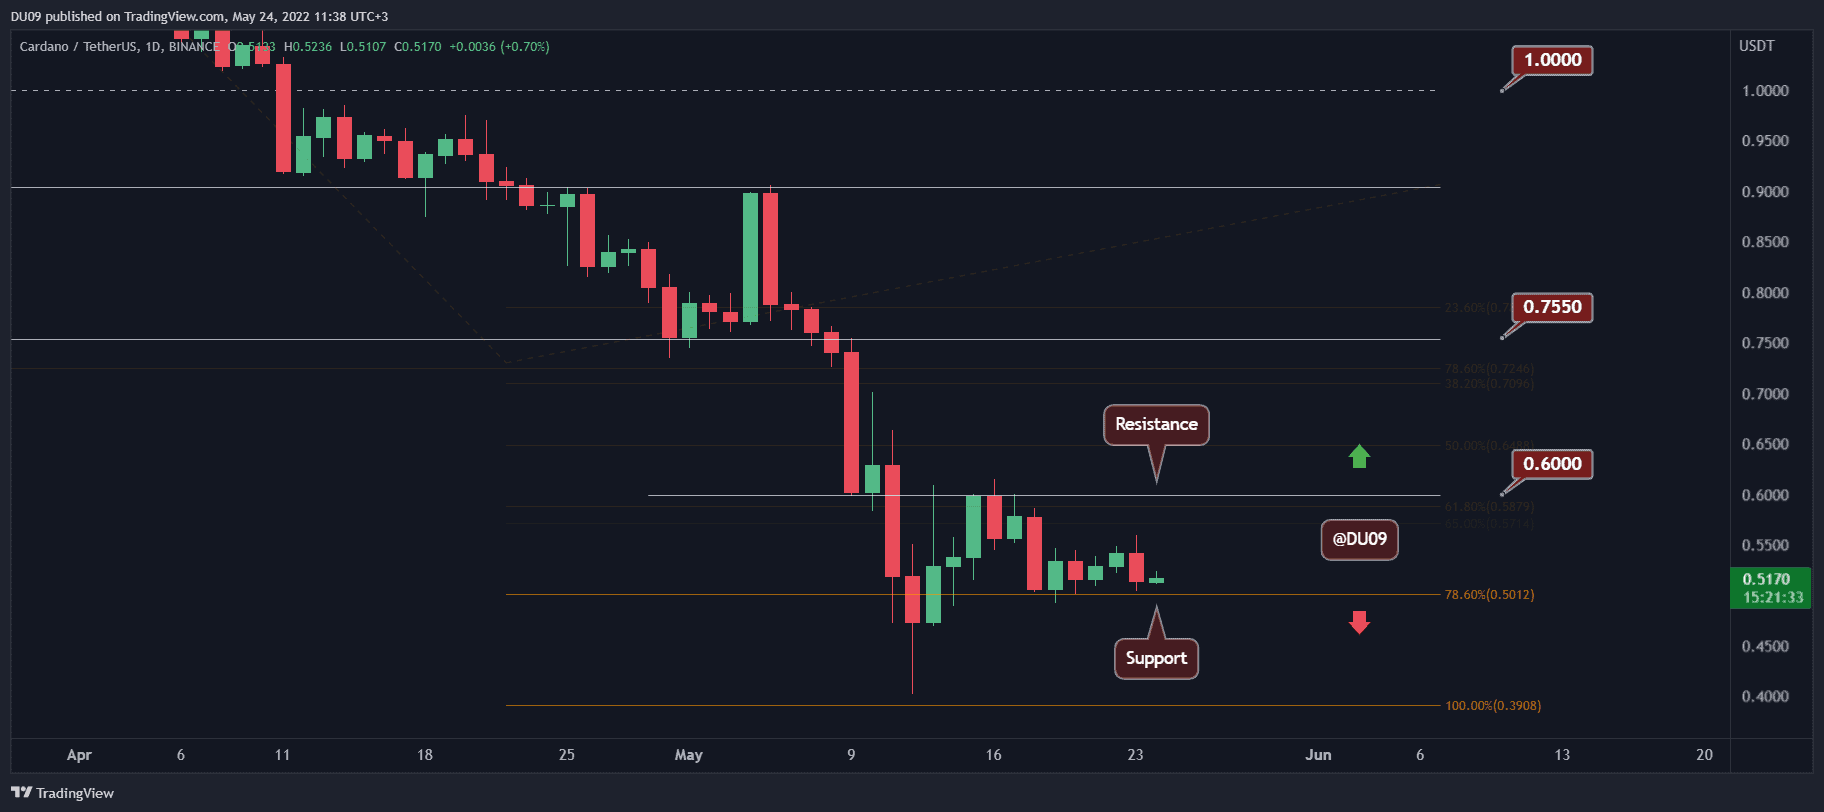
ADA failed to sustain a rally and break the key resistance. Now, the price is dangerously close to a critical support.
Key Support levels: $0.50, $0.40
Key Resistance levels: $0.60, $0.75
ADA attempted to rally yesterday, but the price was quickly pushed back to the key support at $0.50. Should this critical level fall, then the cryptocurrency could go all the way down to $0.40. The important resistance sits at $0.60, and Cardano only managed to test this level once when it was sharply rejected.
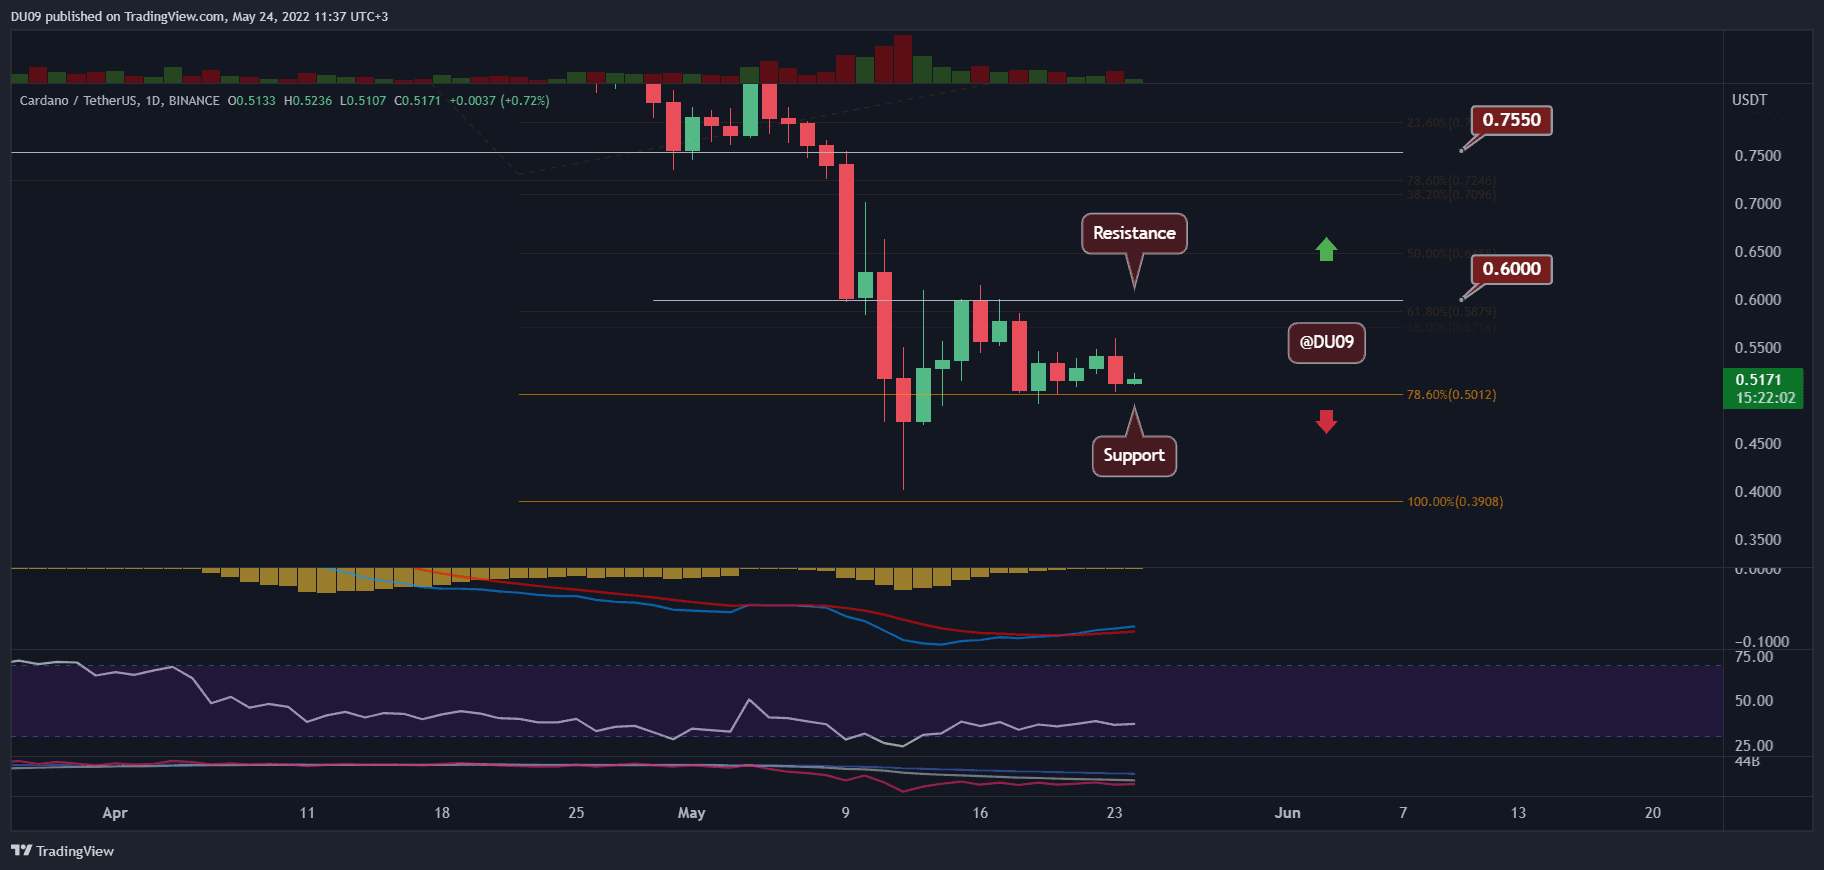
Technical Indicators
Trading Volume: The volume is absent. There is simply no momentum behind the price action, and the best ADA could do is move sideways. This is a sign of weakness in the market.
RSI: The daily RSI made a higher low and higher high, but without volume, this gives little confidence in a sustained recovery.
MACD: The daily MACD remains bullish. The histogram continues to make higher highs and signals that buyers may have the upper hand. However, to confirm this, ADA has to break the resistance at $0.60.
Bias
The bias for ADA is neutral. The cryptocurrency has failed to break above the key resistance, and so long it moves sideways, the bias will remain neutral.
Short-Term Prediction for ADA Price
Similar to most of the crypto market right now, ADA suffers from a lack of volume. For this reason, the best the market can offer right now is a flat trend. This makes it particularly risky, and it’s important to wait for a breakout towards any direction.