Ripple has been experiencing a short-term stage of consolidation following low volatility. The cryptocurrency has formed a well-known bearish flag pattern and has dropped to the middle boundary. This is an important price region, and the upcoming price action will likely determine its mid-term direction. Technical Analysis By Shayan The Daily Chart The cryptocurrency was recently rejected by the upper trendline of the bearish flag pattern and dropped to the middle boundary. This level nearly aligns with strong short-term support at %excerpt%.45. If the price drops below both the boundary and the %excerpt%.45 support level, a plummet toward the channel’s lower trendline will be inevitable. Contrarily, if XRP successfully surpasses the multi-month descending trendline, a rally toward the
Topics:
CryptoVizArt considers the following as important: Ripple (XRP) Price, XRP Analysis, xrpbtc, xrpusd
This could be interesting, too:
Jordan Lyanchev writes Ripple’s (XRP) Surge to Triggers Over Million in Short Liquidations
Jordan Lyanchev writes Trump Confirms Work on Strategic Crypto Reserve: XRP, ADA, SOL Included
Dimitar Dzhondzhorov writes Is a Major Ripple v. SEC Lawsuit Development Expected This Week? Here’s Why
Mandy Williams writes Ripple Releases Institutional DeFi Roadmap for XRP Ledger in 2025
Ripple has been experiencing a short-term stage of consolidation following low volatility. The cryptocurrency has formed a well-known bearish flag pattern and has dropped to the middle boundary. This is an important price region, and the upcoming price action will likely determine its mid-term direction.
Technical Analysis
By Shayan
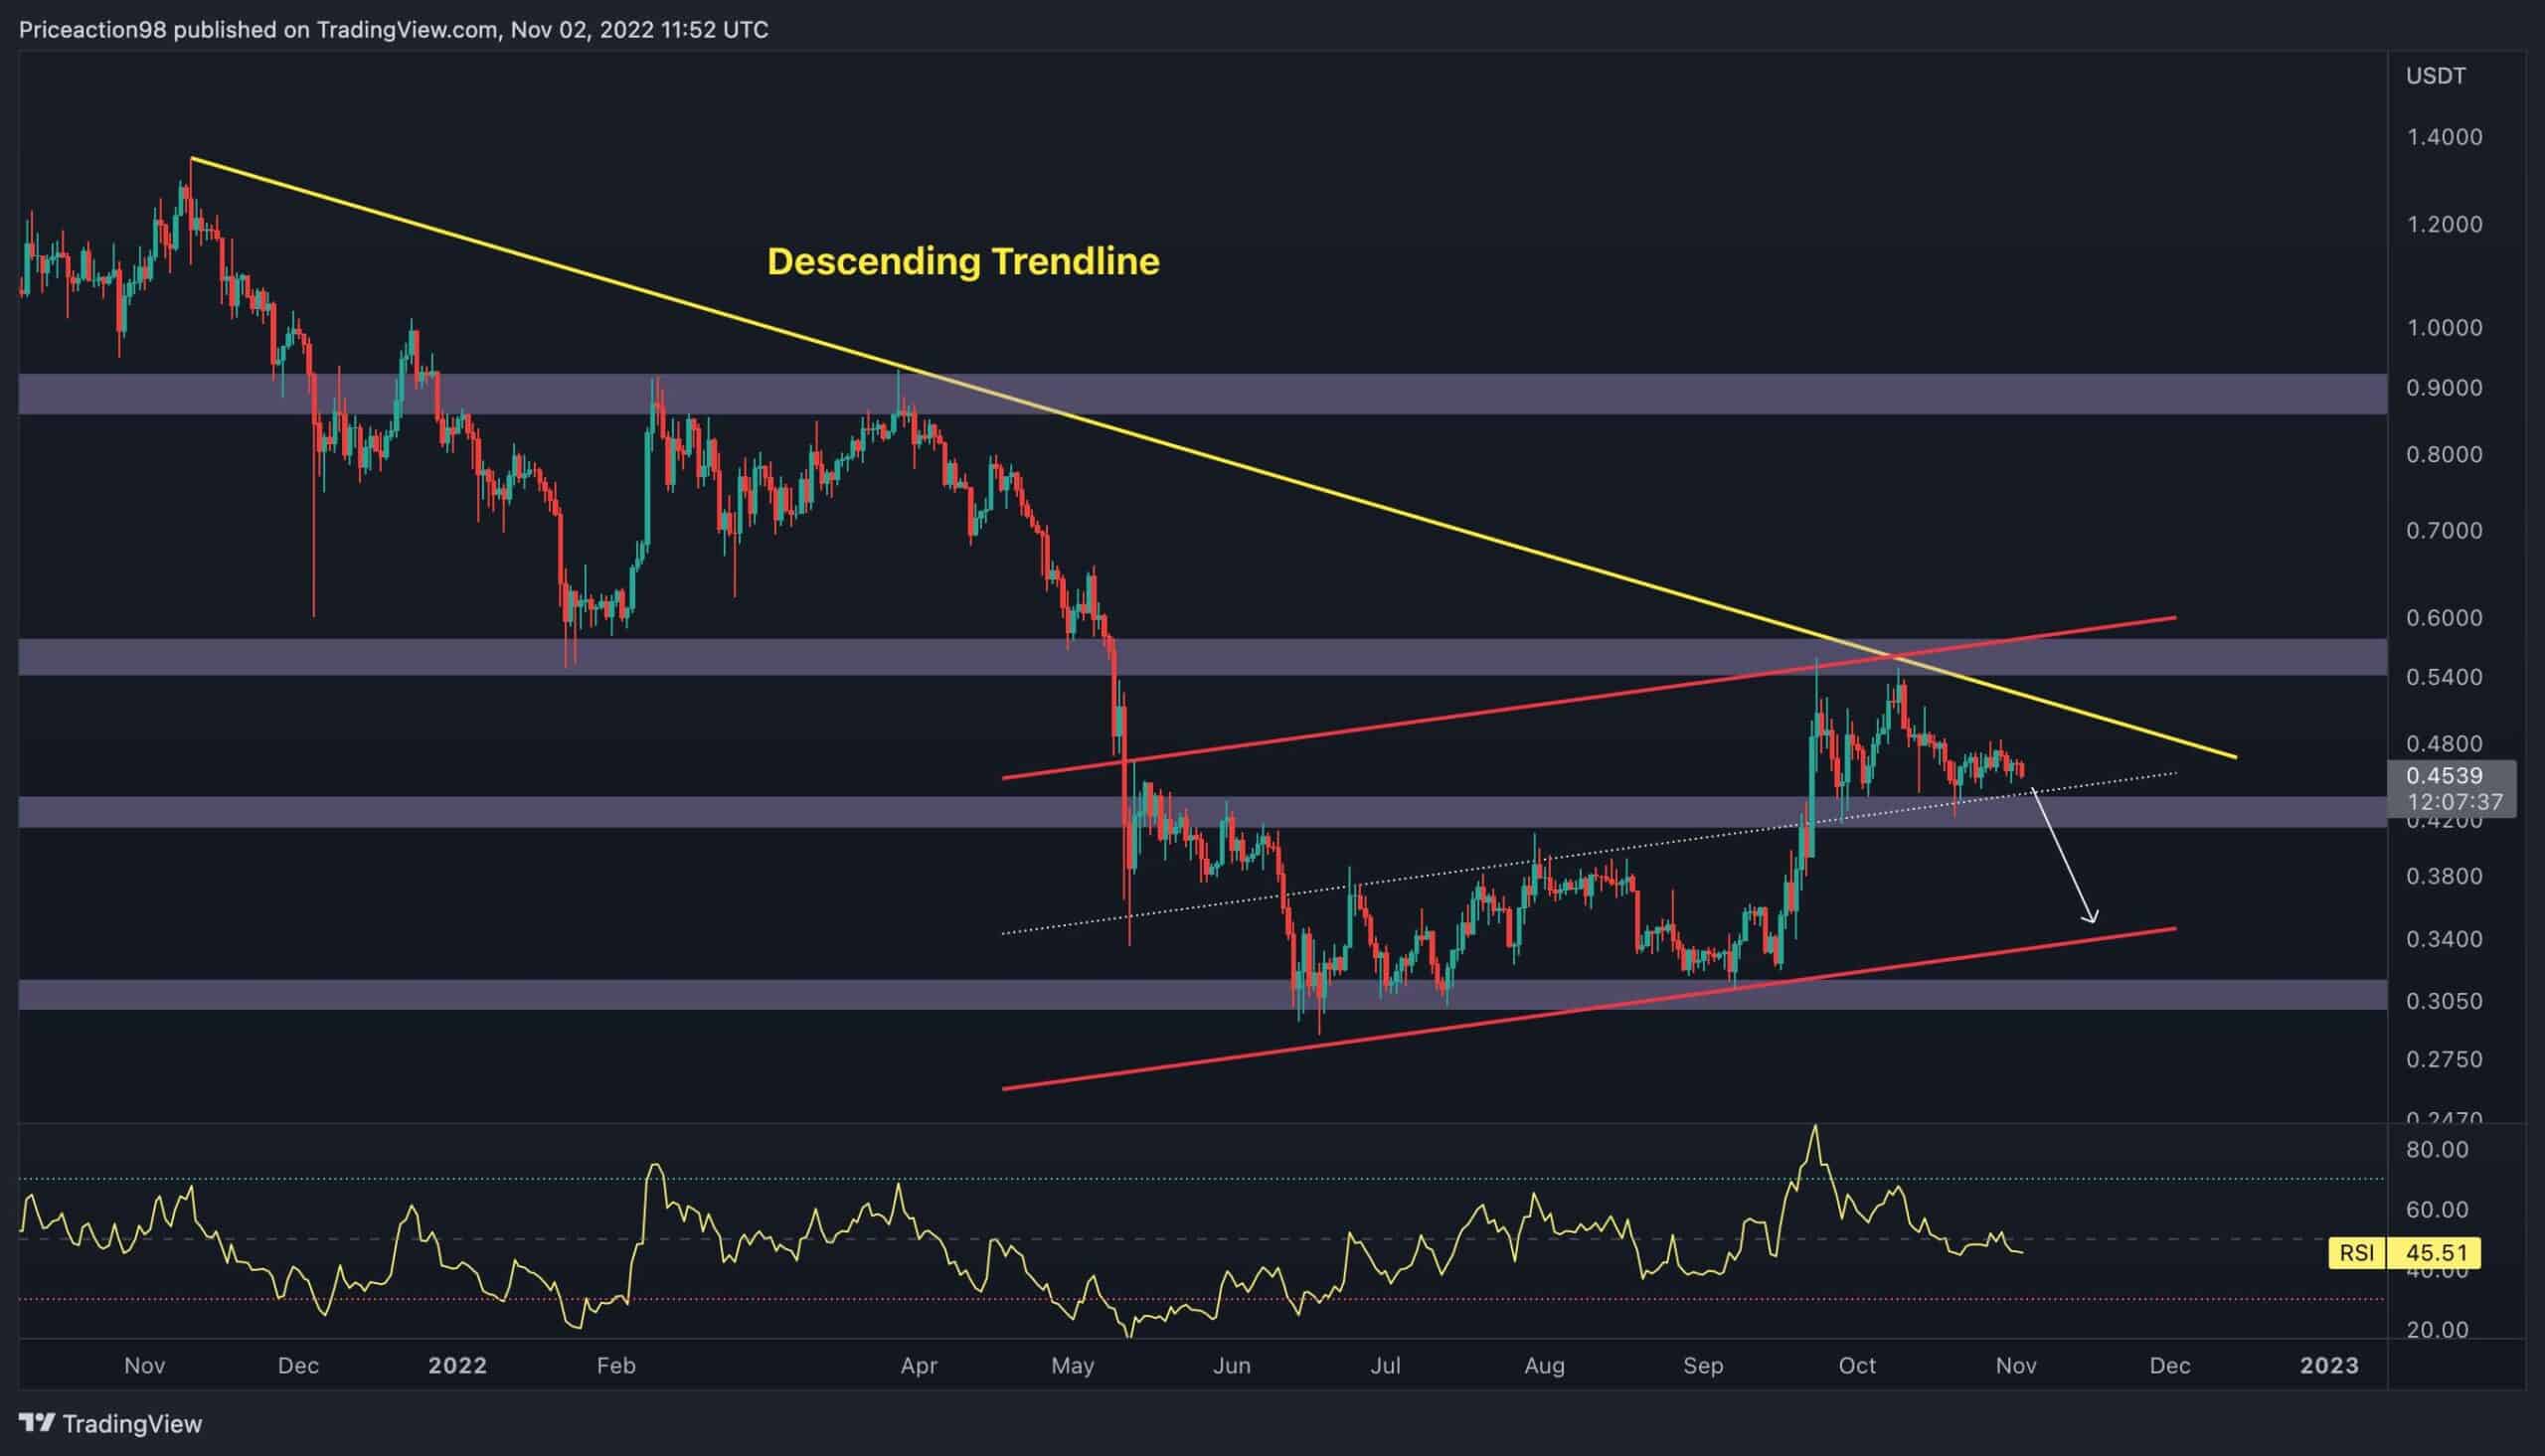
The Daily Chart
The cryptocurrency was recently rejected by the upper trendline of the bearish flag pattern and dropped to the middle boundary. This level nearly aligns with strong short-term support at $0.45.
If the price drops below both the boundary and the $0.45 support level, a plummet toward the channel’s lower trendline will be inevitable. Contrarily, if XRP successfully surpasses the multi-month descending trendline, a rally toward the $0.85 resistance region is anticipated.
However, the bearish scenario has a greater chance to occur due to the crypto market’s lack of activity and demand.
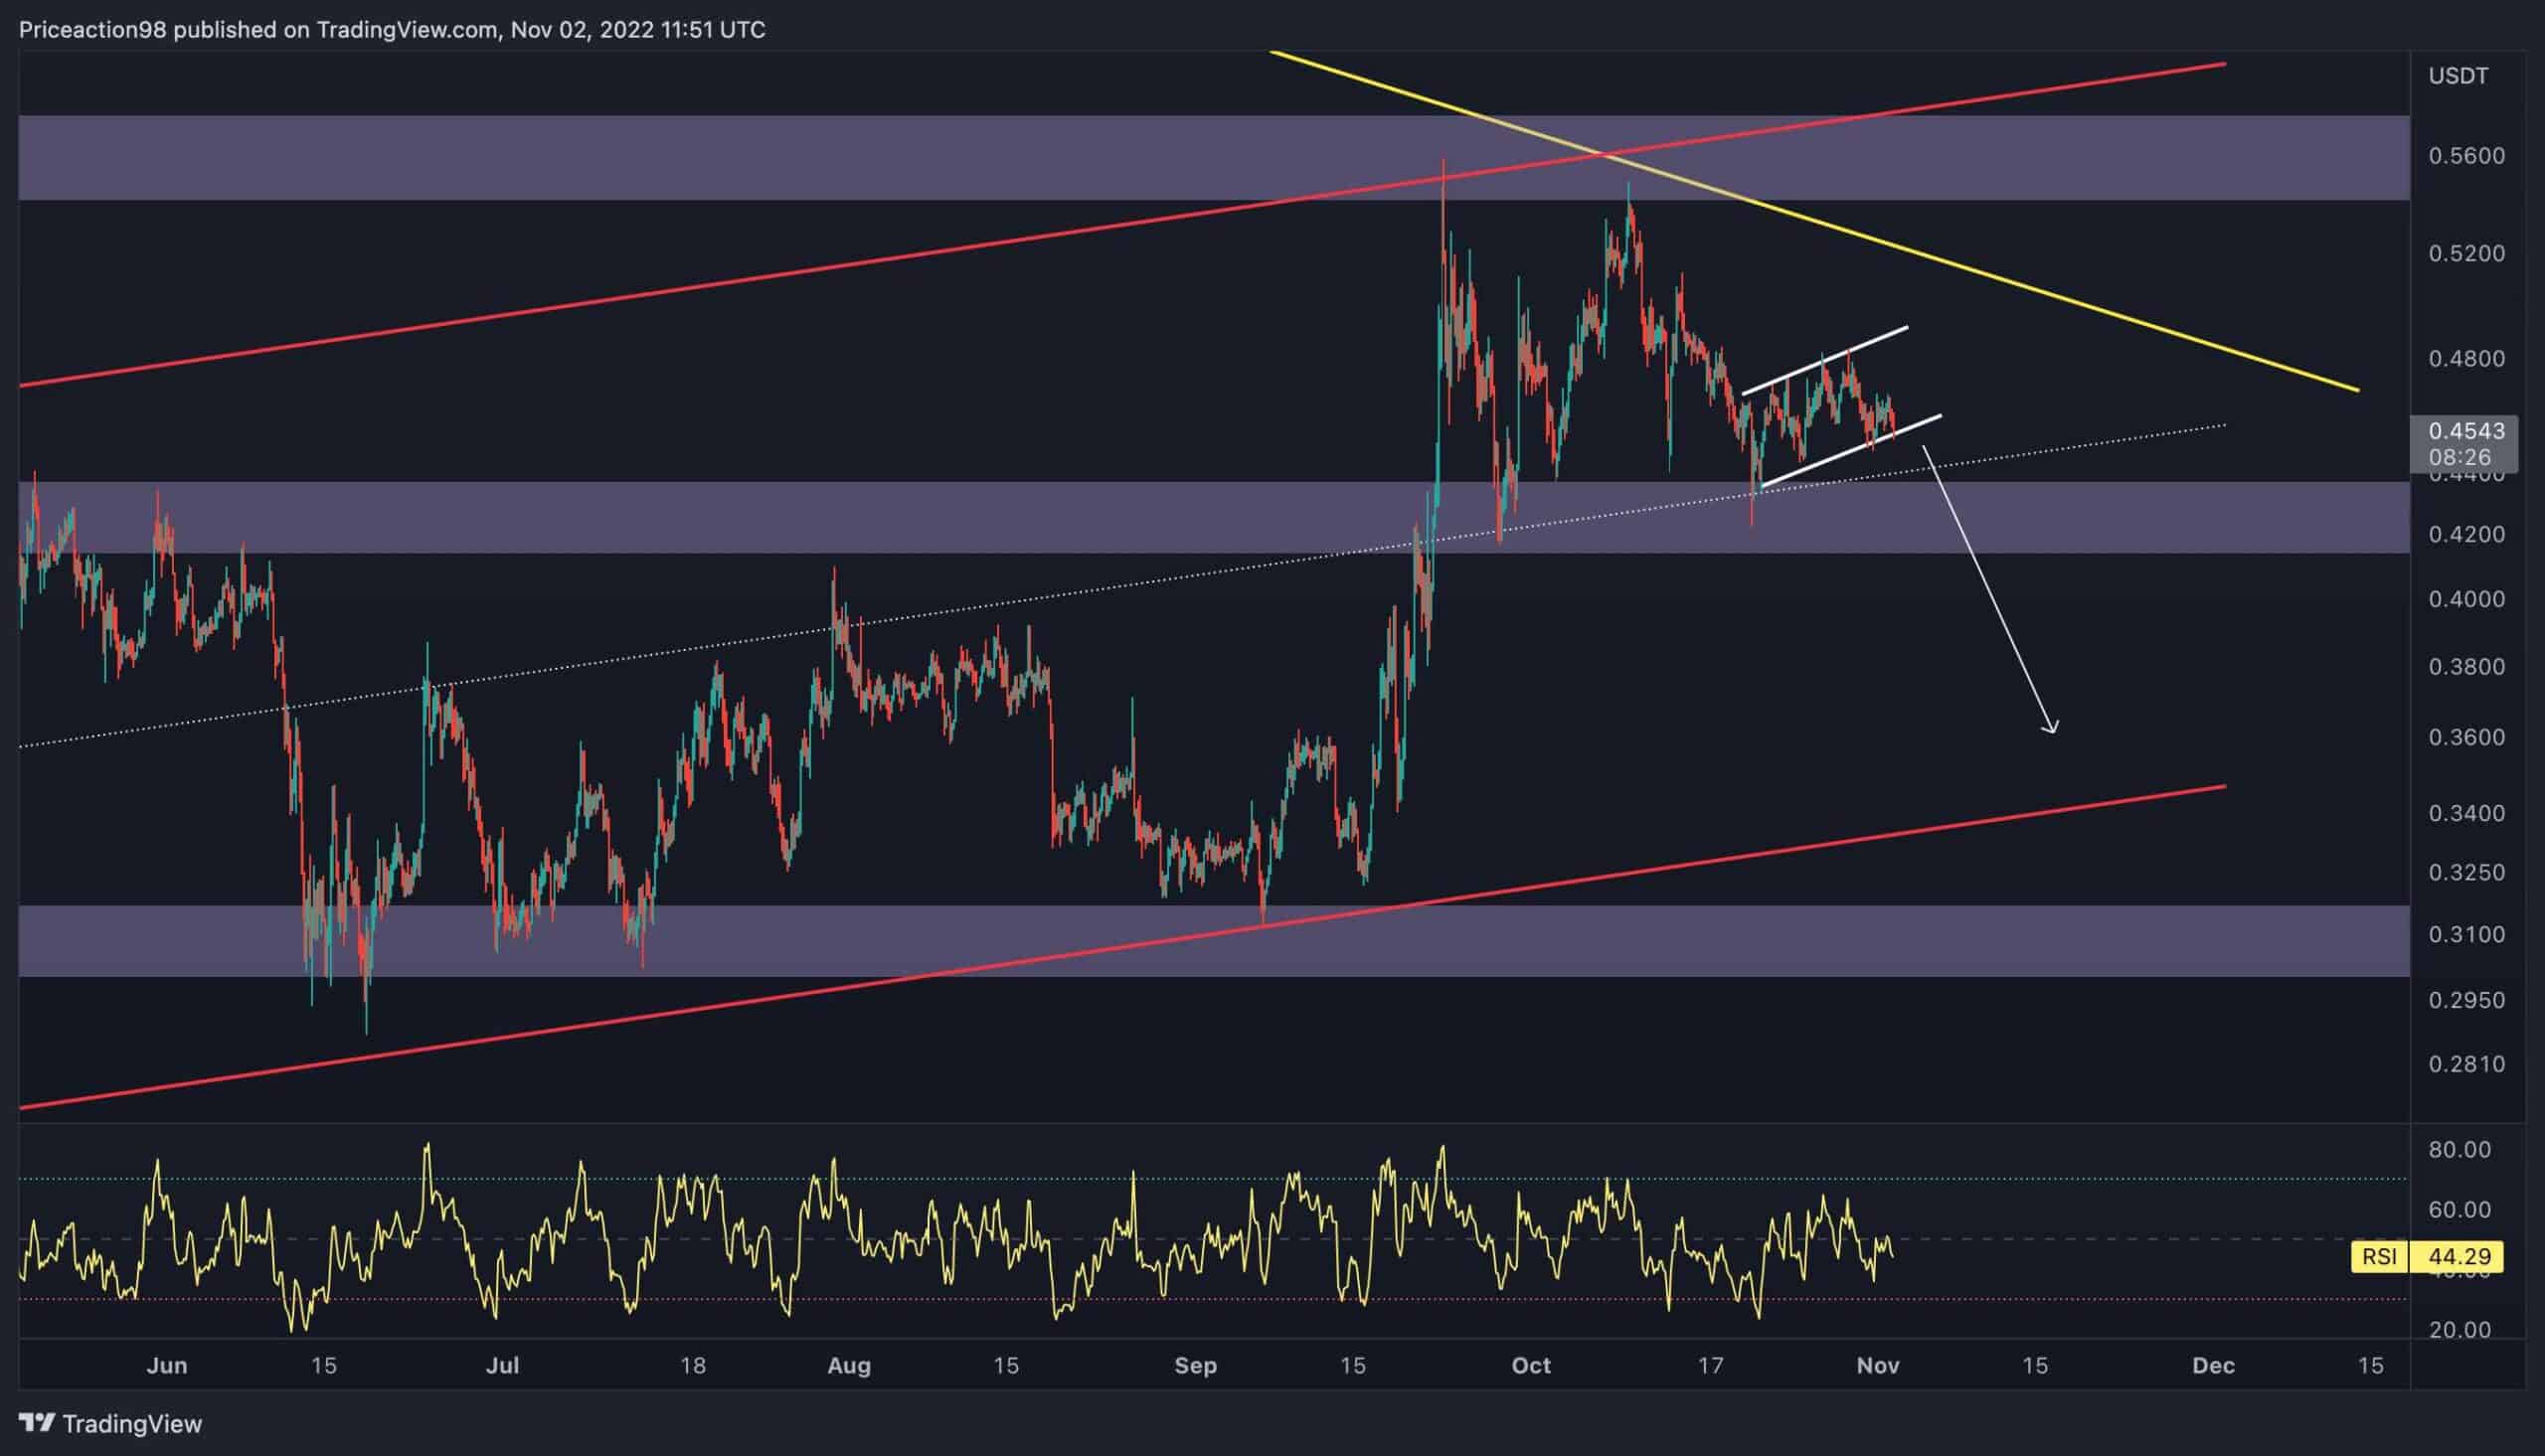
The 4-Hour Chart
In the 4-hour timeframe, XRP has formed another well-known bearish pattern called “head and shoulders.” The price is currently attempting to break the neckline of this pattern.
The neckline intersects with the 0.45 support level and the flag’s trendline. This alignment makes this price level a significant support for the cryptocurrency.
If Ripple breaks below this level, the cascade will be the most probable scenario. Hence, the upcoming price action should determine XRP’s mid-term direction.