Ethereum experienced a considerable increase in the final days of October, resulting in a green monthly candle. To continue this growth, the cryptocurrency must retain ,500 as support. Technical Analysis By Grizzly The Daily Chart After 40 days, the price of ETH officially surpassed ,500 towards the end of October. Since then, the cryptocurrency has slowed down after hitting the resistance zone of 50-00 (in red). With the test of this resistance and the approaching FOMC meeting, it appears that some traders have opted to close their long positions. As a result, the bullish momentum has weakened slightly. If Ethereum can establish ,500 as support and does not close below this crucial mark, it could retest ,700, which overlaps the 200-day moving average.
Topics:
CryptoVizArt considers the following as important: ETH Analysis, ETHBTC, Ethereum (ETH) Price, ethusd
This could be interesting, too:
Mandy Williams writes Ethereum Derivatives Metrics Signal Modest Downside Tail Risk Ahead: Nansen
Jordan Lyanchev writes Weekly Bitcoin, Ethereum ETF Recap: Light at the End of the Tunnel for BTC
CryptoVizArt writes Will Weak Momentum Drive ETH to .5K? (Ethereum Price Analysis)
Jordan Lyanchev writes Bybit Hack Fallout: Arthur Hayes, Samson Mow Push for Ethereum Rollback
Ethereum experienced a considerable increase in the final days of October, resulting in a green monthly candle. To continue this growth, the cryptocurrency must retain $1,500 as support.
Technical Analysis
By Grizzly
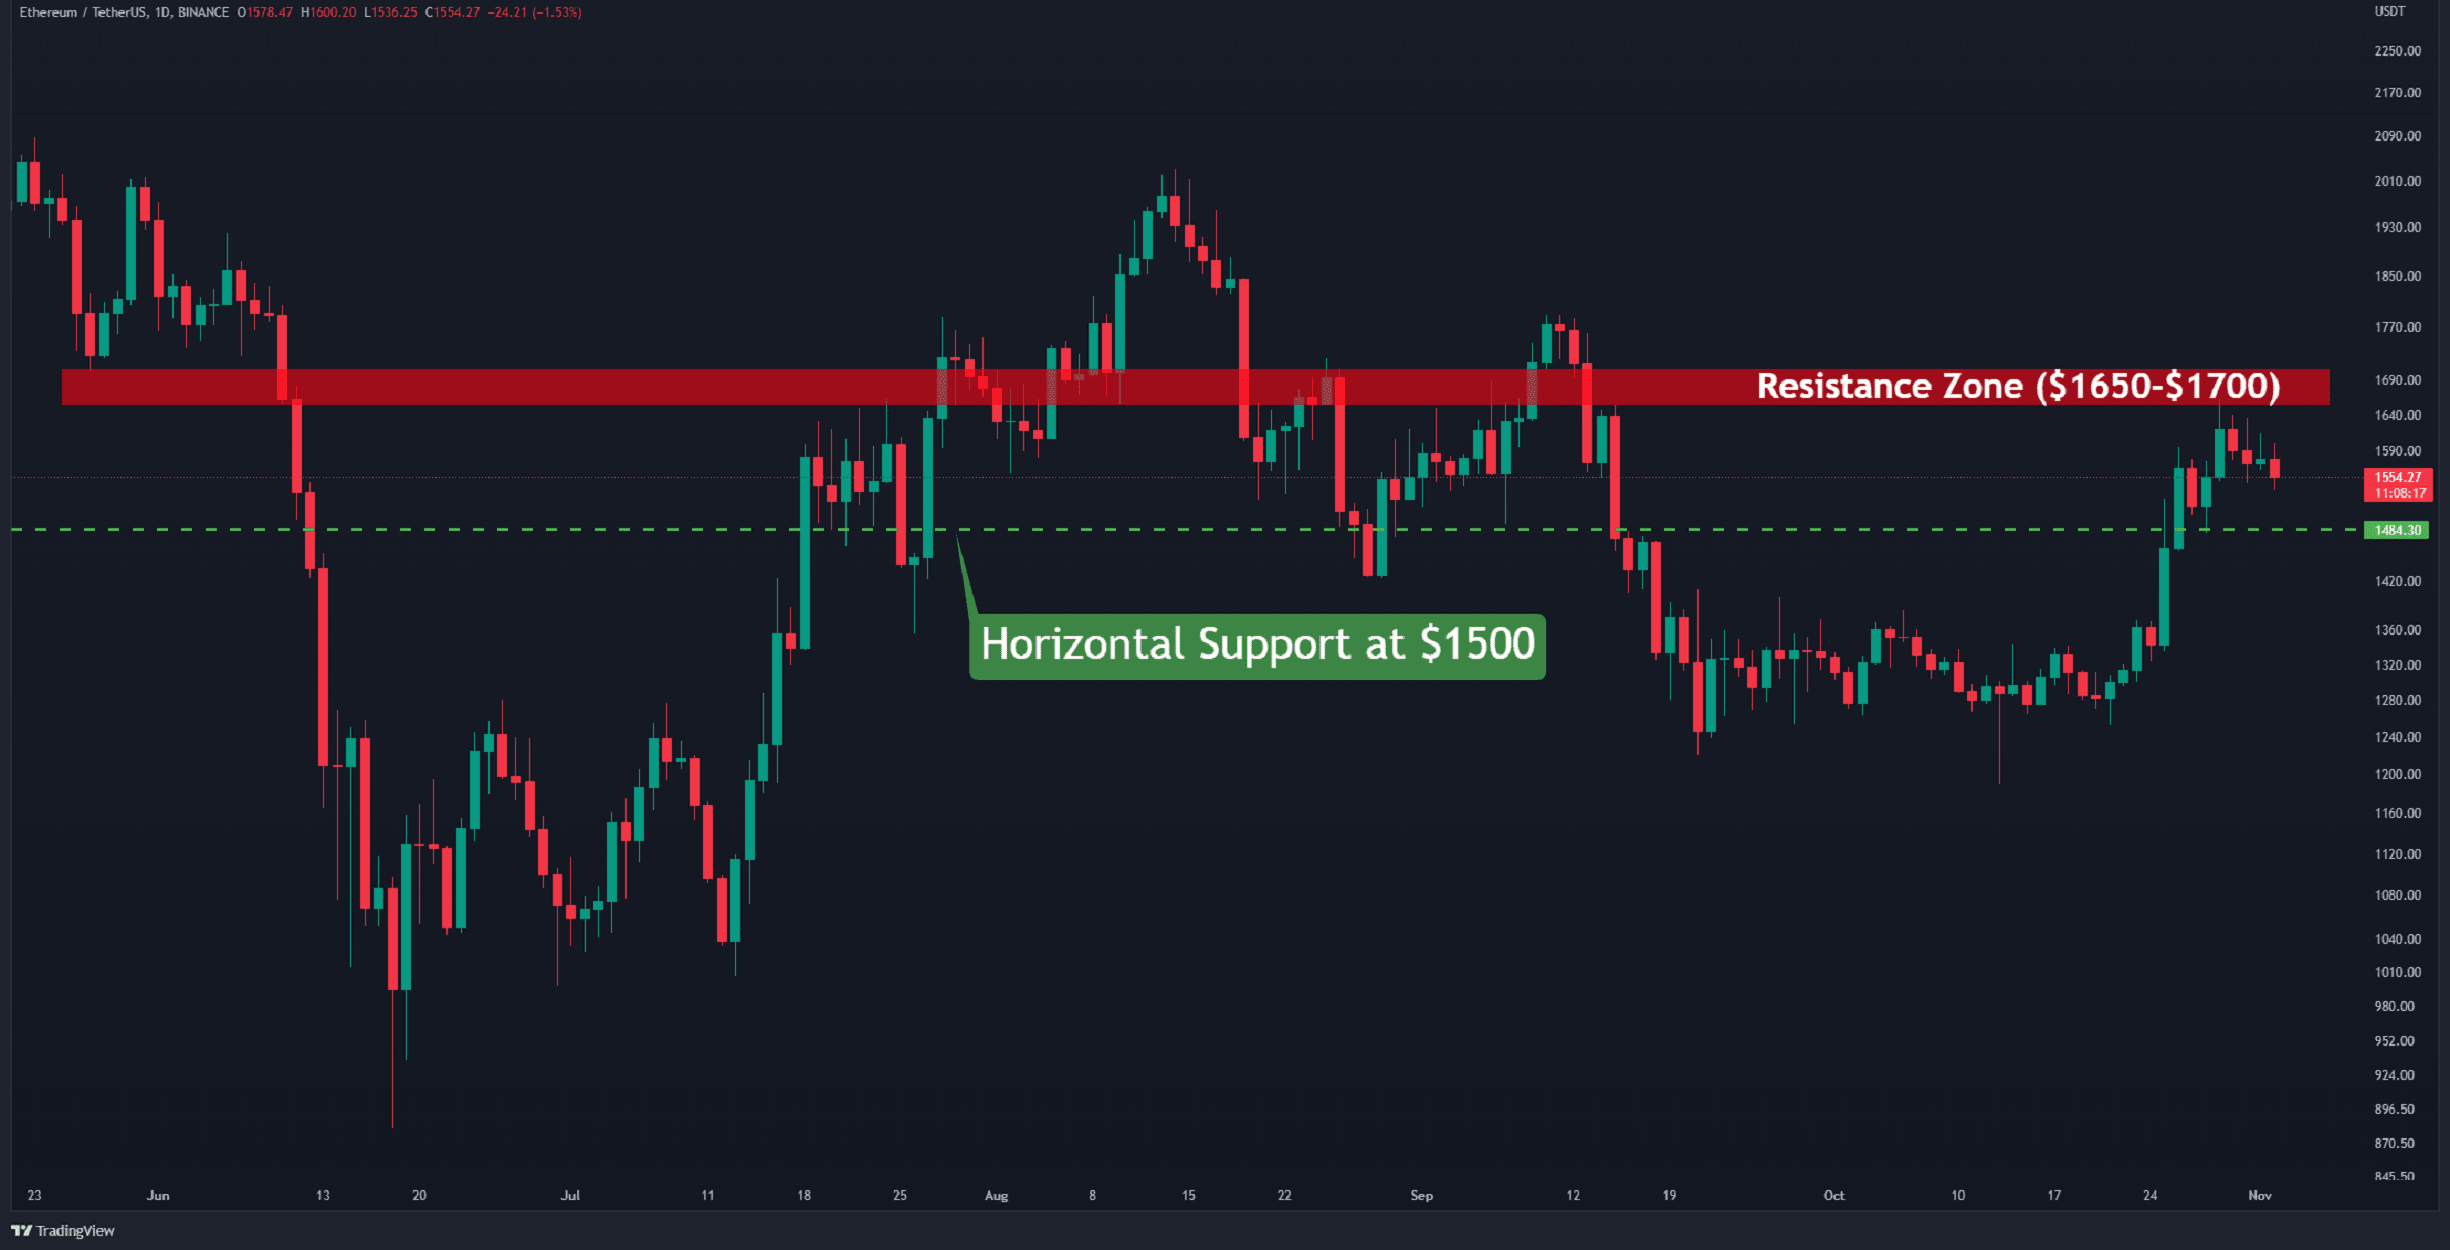
The Daily Chart
After 40 days, the price of ETH officially surpassed $1,500 towards the end of October. Since then, the cryptocurrency has slowed down after hitting the resistance zone of $1650-$1700 (in red).
With the test of this resistance and the approaching FOMC meeting, it appears that some traders have opted to close their long positions. As a result, the bullish momentum has weakened slightly.
If Ethereum can establish $1,500 as support and does not close below this crucial mark, it could retest $1,700, which overlaps the 200-day moving average.
Alternatively, if the Federal Reserve does not signify any willingness to slow rate hikes later in the year, selling pressure on high-risk assets is likely to increase. In this case, the return of the upward trend would be out of the question.
Key Support Levels: $1500 & $1370
Key Resistance Levels: $1700 & $2000
Daily Moving Averages:
MA20: $1420
MA50: $1374
MA100: $1526
MA200: $1676
The ETH/BTC Chart:
Against Bitcoin, the descending line (in white) continually prevented the price from falling in the previous month, which allowed the cryptocurrency to recover.
The horizontal level (in yellow) was broken around 0.073 BTC as a result of this move. 0.073 BTC looks likely to be tested as support right now. If the pair can stay above this level, a move to retest the resistance at 0.085 BTC (in red) would also become more probable.
Key Support Levels: 0.073 & 0.07 BTC
Key Resistance Levels: 0.08 & 0.085 BTC

Sentiment Analysis
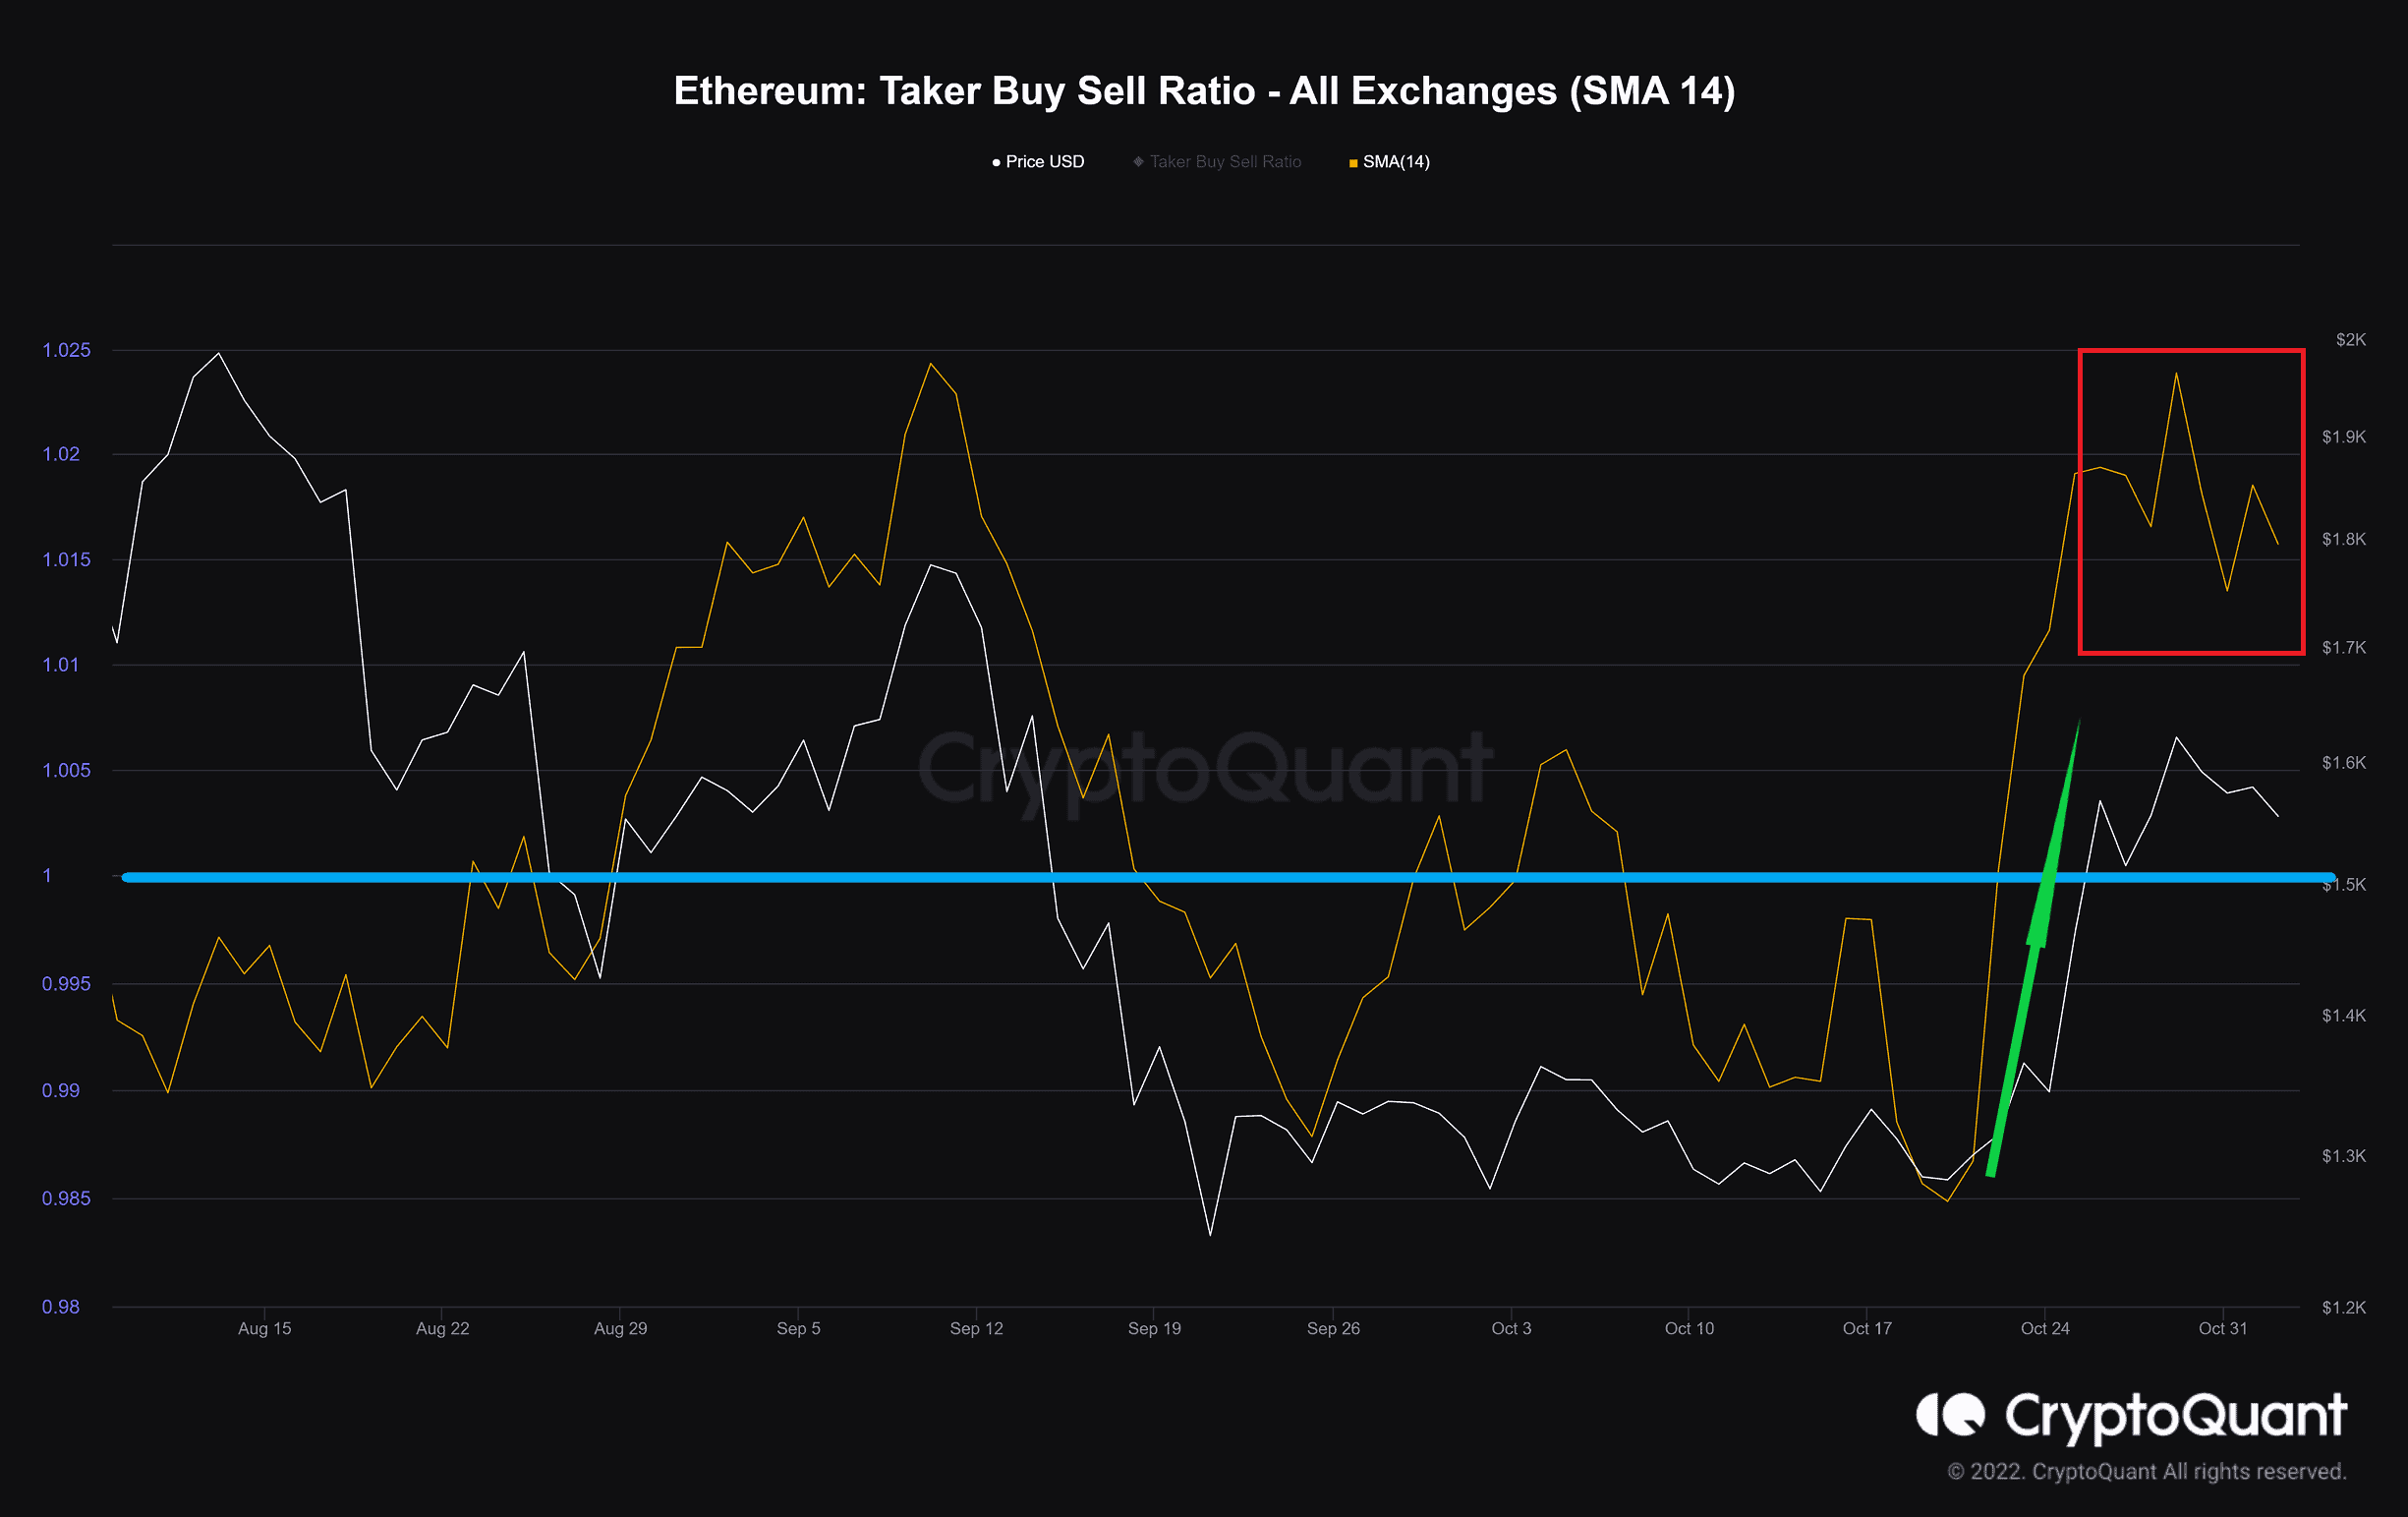
Taker Buy Sell Ratio (SMA 14)
Definition: The ratio of buy volume divided by the sell volume of takers in perpetual swap trades.
Values over 1 indicate bullish sentiment is dominant.
Values under 1 indicate bearish sentiment is dominant.
The derivative market is dominated by bullish sentiment. The large increase in this index, which implies that many buy orders were filled by takers, caused the price to soar. However, this sentiment appears to be weakening.
The FOMC meeting tonight is currently the focus of everyone’s attention, as it could have some impact on upcoming trends in the market.