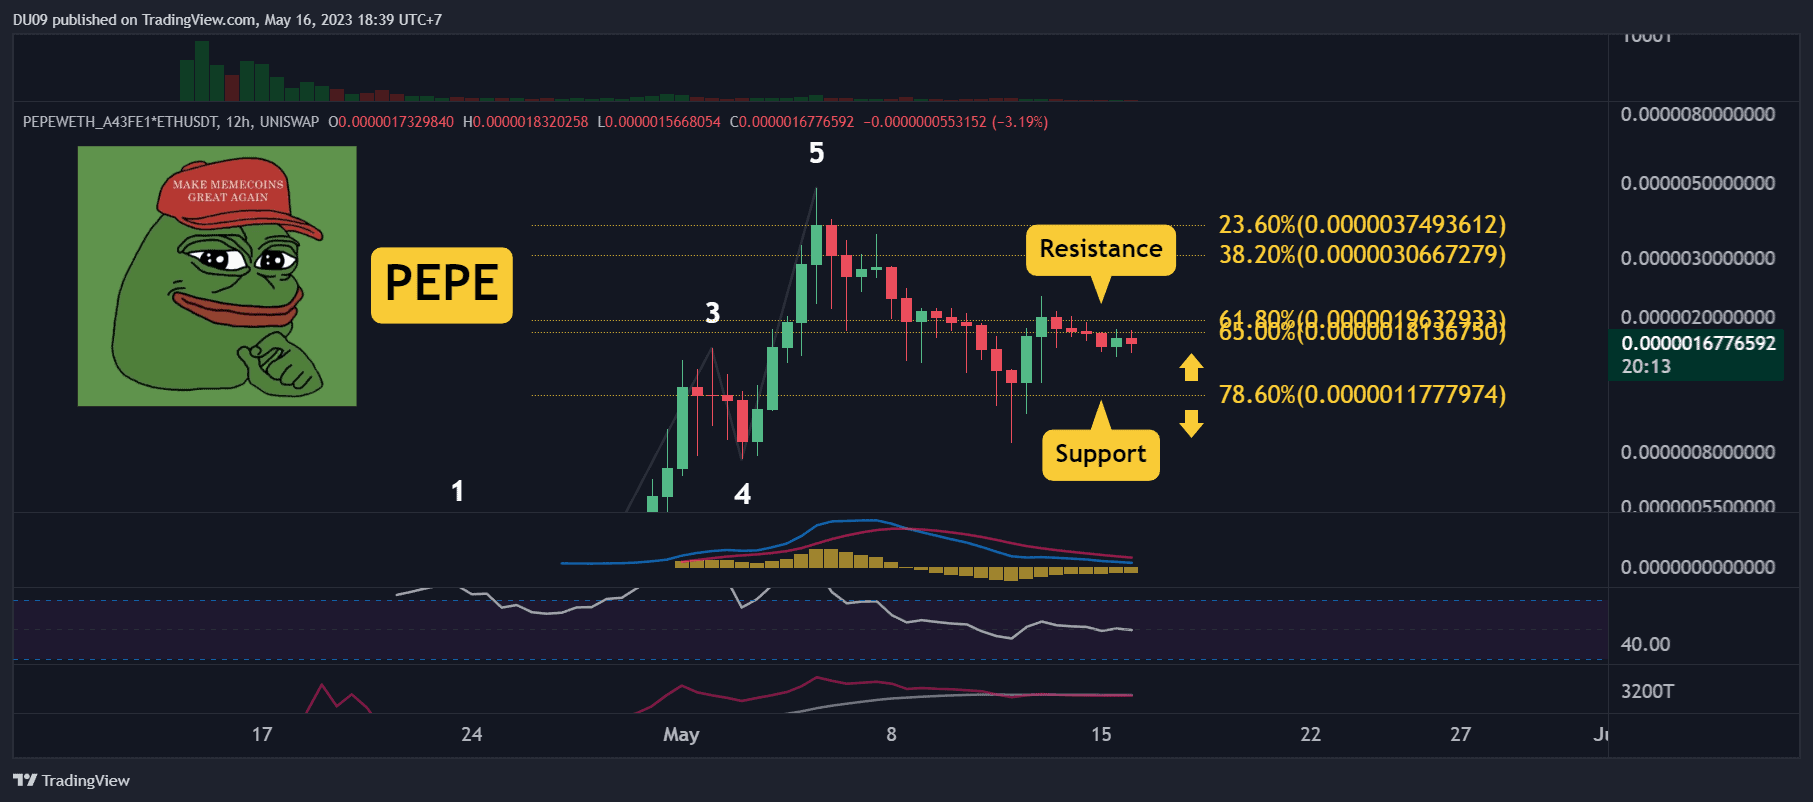
PEPE managed to find support and buyers were quick to jump in over the weekend. Key Support levels: %excerpt%.0000011 Key Resistance levels: %excerpt%.0000020 This meme coin managed to rally and double in price between Friday and Saturday, but it was not enough to break the key resistance at %excerpt%.0000020. Sellers came in strong and stopped the rally. In the process, the price made a lower high which is a bearish signal. The current support is at %excerpt%.0000011. Chart by TradingViewTrading Volume: The volume increased over the weekend, but this quickly faded as of Tuesday. Buyers could not sustain the rally. RSI: The 12h RSI made a lower high and is again under 50 points. This is bearish. MACD: The 12h MACD is bearish, but the histogram is making higher lows. This shows that sellers have lost
Topics:
Duo Nine considers the following as important: PEPE, Price Analysis
This could be interesting, too:
Bitcoin Schweiz News writes Früh in Meme Coins einsteigen?
Bitcoin Schweiz News writes ? Darum ist Meme Coin Trading auf Binance so aufregend – Gewinne, Hype und verrückte Moves!
Chayanika Deka writes Dormant PEPE Wallet Awakens: 2.1 Trillion Tokens Moved Amid Crypto Rally
Wayne Jones writes How a Small K Investment in Pepe Netted Crypto Trader M: Data
PEPE managed to find support and buyers were quick to jump in over the weekend.
Key Support levels: $0.0000011
Key Resistance levels: $0.0000020
This meme coin managed to rally and double in price between Friday and Saturday, but it was not enough to break the key resistance at $0.0000020. Sellers came in strong and stopped the rally. In the process, the price made a lower high which is a bearish signal. The current support is at $0.0000011.
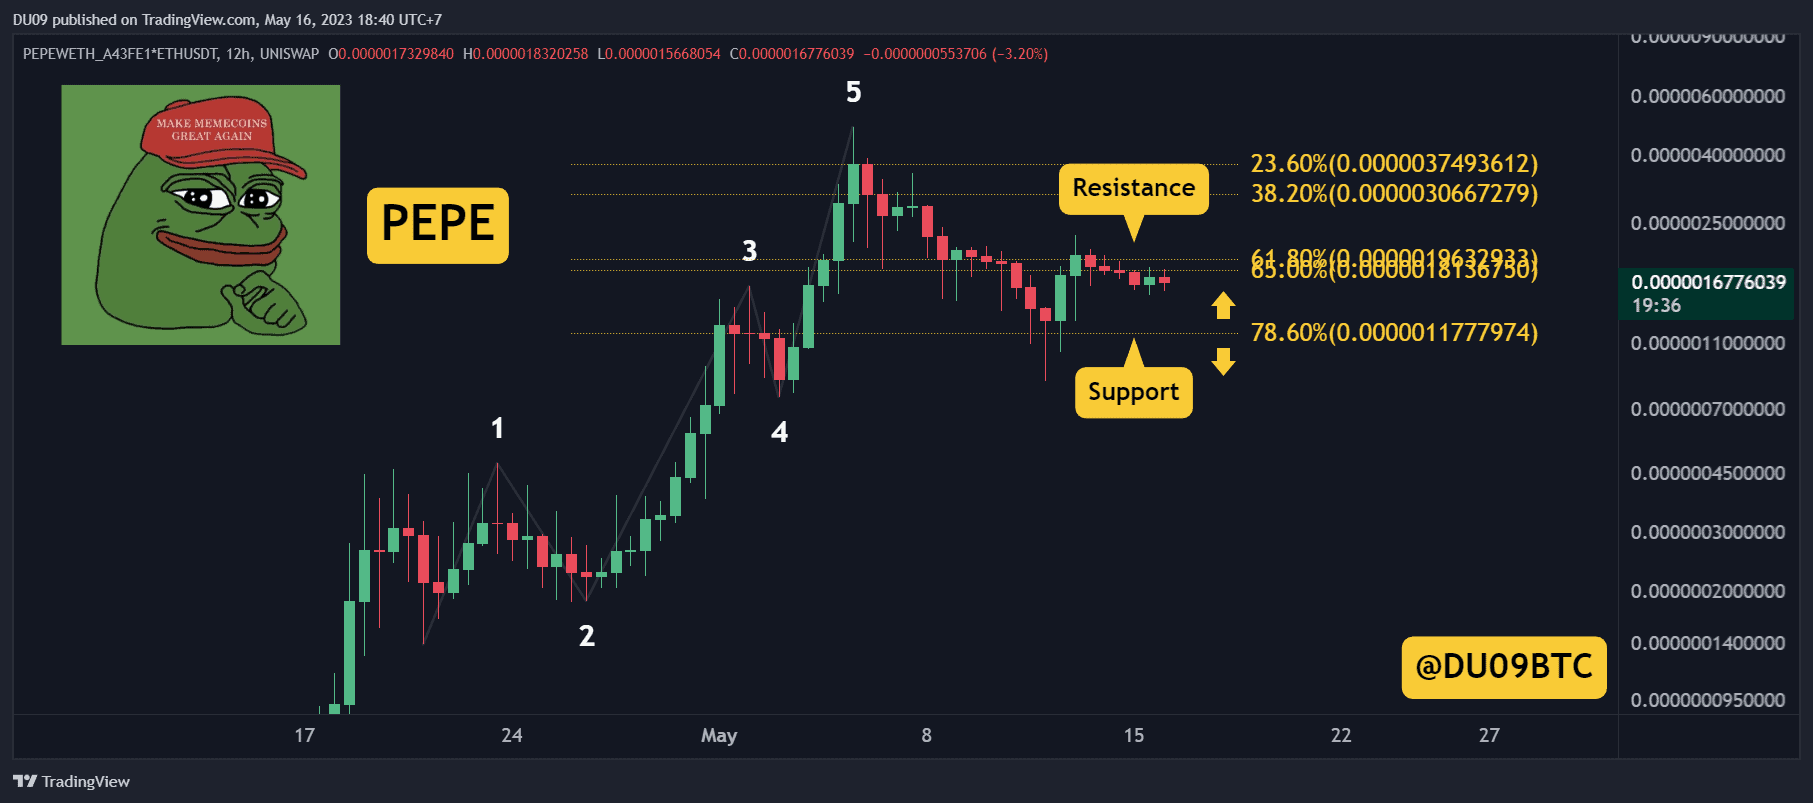
Trading Volume: The volume increased over the weekend, but this quickly faded as of Tuesday. Buyers could not sustain the rally.
RSI: The 12h RSI made a lower high and is again under 50 points. This is bearish.
MACD: The 12h MACD is bearish, but the histogram is making higher lows. This shows that sellers have lost some momentum.
Bias
The bias for PEPE is bearish so long it cannot break the key resistance.
Short-Term Prediction for PEPE Price
With buyers absent, it appears PEPE is unable to break higher at this time and has been ranging under the key resistance at $0.0000020. This can continue for the remainder of the week.