Ripple’s price has broken above a critical resistance level on the XRP/USD paired chart, which could initiate a rally in the coming days. Yet, it could still be too early to state that the bear market is over. Technical Analysis By: Edris XRP/USD Daily Chart On the USDT paired chart, the price has broken above the 50-day and 200-day moving average lines, along with the critical %excerpt%.43 resistance level. The breakout comes after months of consolidation. However, the price is now retesting the broken %excerpt%.43 level, this time as support. If the level holds, a bullish continuation toward the %excerpt%.55 area could be expected in the short term. Still, the RSI indicator has recently printed an overbought signal, which could indicate the possibility of a failed breakout (fakeout). This
Topics:
CryptoVizArt considers the following as important: Ripple (XRP) Price, XRP Analysis, xrpbtc, xrpusd
This could be interesting, too:
Jordan Lyanchev writes Ripple’s (XRP) Surge to Triggers Over Million in Short Liquidations
Jordan Lyanchev writes Trump Confirms Work on Strategic Crypto Reserve: XRP, ADA, SOL Included
Dimitar Dzhondzhorov writes Is a Major Ripple v. SEC Lawsuit Development Expected This Week? Here’s Why
Mandy Williams writes Ripple Releases Institutional DeFi Roadmap for XRP Ledger in 2025
Ripple’s price has broken above a critical resistance level on the XRP/USD paired chart, which could initiate a rally in the coming days. Yet, it could still be too early to state that the bear market is over.
Technical Analysis
By: Edris
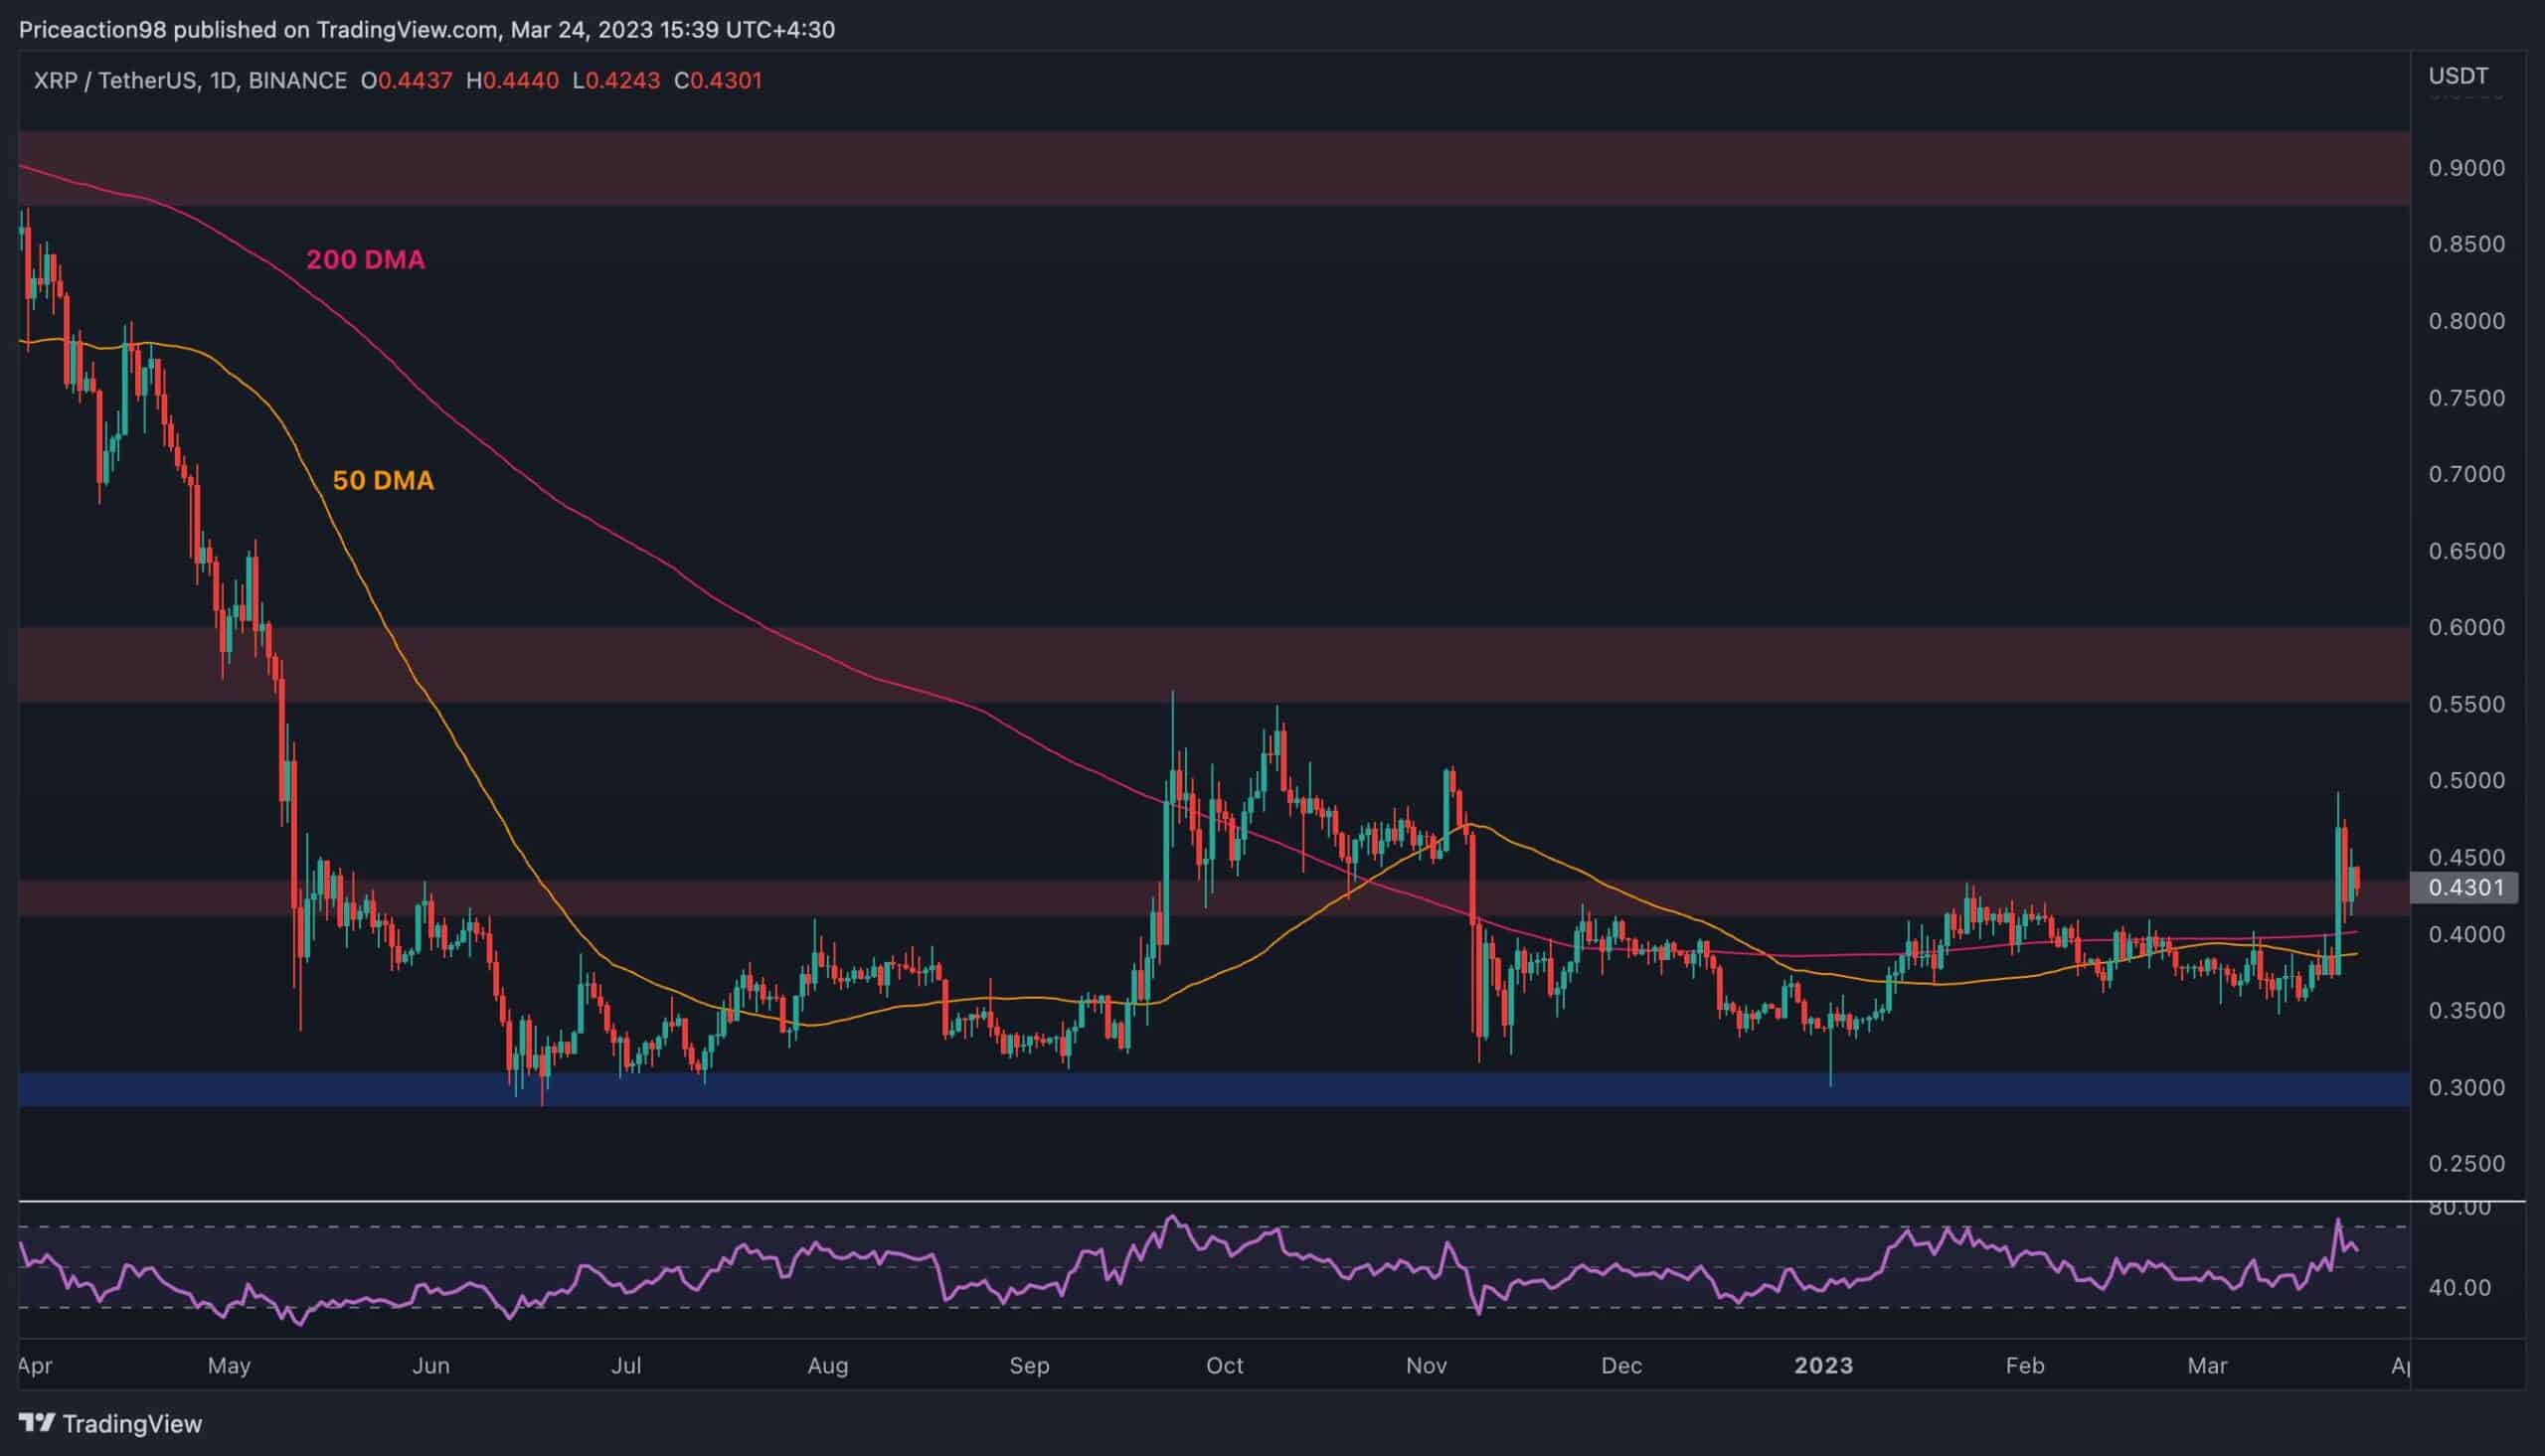
XRP/USD Daily Chart
On the USDT paired chart, the price has broken above the 50-day and 200-day moving average lines, along with the critical $0.43 resistance level. The breakout comes after months of consolidation.
However, the price is now retesting the broken $0.43 level, this time as support. If the level holds, a bullish continuation toward the $0.55 area could be expected in the short term.
Still, the RSI indicator has recently printed an overbought signal, which could indicate the possibility of a failed breakout (fakeout). This would be disastrous for the bulls, as the market could drop rapidly back toward the $0.3 level.
XRP/BTC Daily Chart
Looking at the BTC paired chart, the price has similarly broken above a significant resistance level around the 0.000015 SAT area.
However, the 50-day moving average line, located near the 0.000017 SAT mark, has rejected the price, and since then, the price has been heading lower to a retest of the broken 0.000015 SAT level. If the level holds, the price could target the 0.000018 SAT area in the coming weeks.
On the other hand, a drop below the 0.000015 SAT area could lead to a decline toward the 0.000013 level and the lower boundary of the large descending channel.
