Ethereum’s price has been consolidating over the past week as the price is struggling to break above a key resistance area. Did ETH mark a local top? Technical Analysis By: Edris The Daily Chart: On the daily time frame, ETH’s price has broken above the symmetrical triangle pattern lately and above the 50-day moving average line (around the 00 mark). However, ETH is trading inside a very tight range above the broken triangle and has yet to break with confidence above the 00 level. If the market fails, a pullback toward the 50-day and even the 200-day moving average located around the 00 and 00 levels, respectively, could be expected. On the other hand, a valid break above the 00 level could lead to another short-term rally – first to target the K level for
Topics:
CryptoVizArt considers the following as important: ETH Analysis, ETHBTC, Ethereum (ETH) Price, ethusd
This could be interesting, too:
Mandy Williams writes Ethereum Derivatives Metrics Signal Modest Downside Tail Risk Ahead: Nansen
Jordan Lyanchev writes Weekly Bitcoin, Ethereum ETF Recap: Light at the End of the Tunnel for BTC
CryptoVizArt writes Will Weak Momentum Drive ETH to .5K? (Ethereum Price Analysis)
Jordan Lyanchev writes Bybit Hack Fallout: Arthur Hayes, Samson Mow Push for Ethereum Rollback
Ethereum’s price has been consolidating over the past week as the price is struggling to break above a key resistance area. Did ETH mark a local top?
Technical Analysis
By: Edris
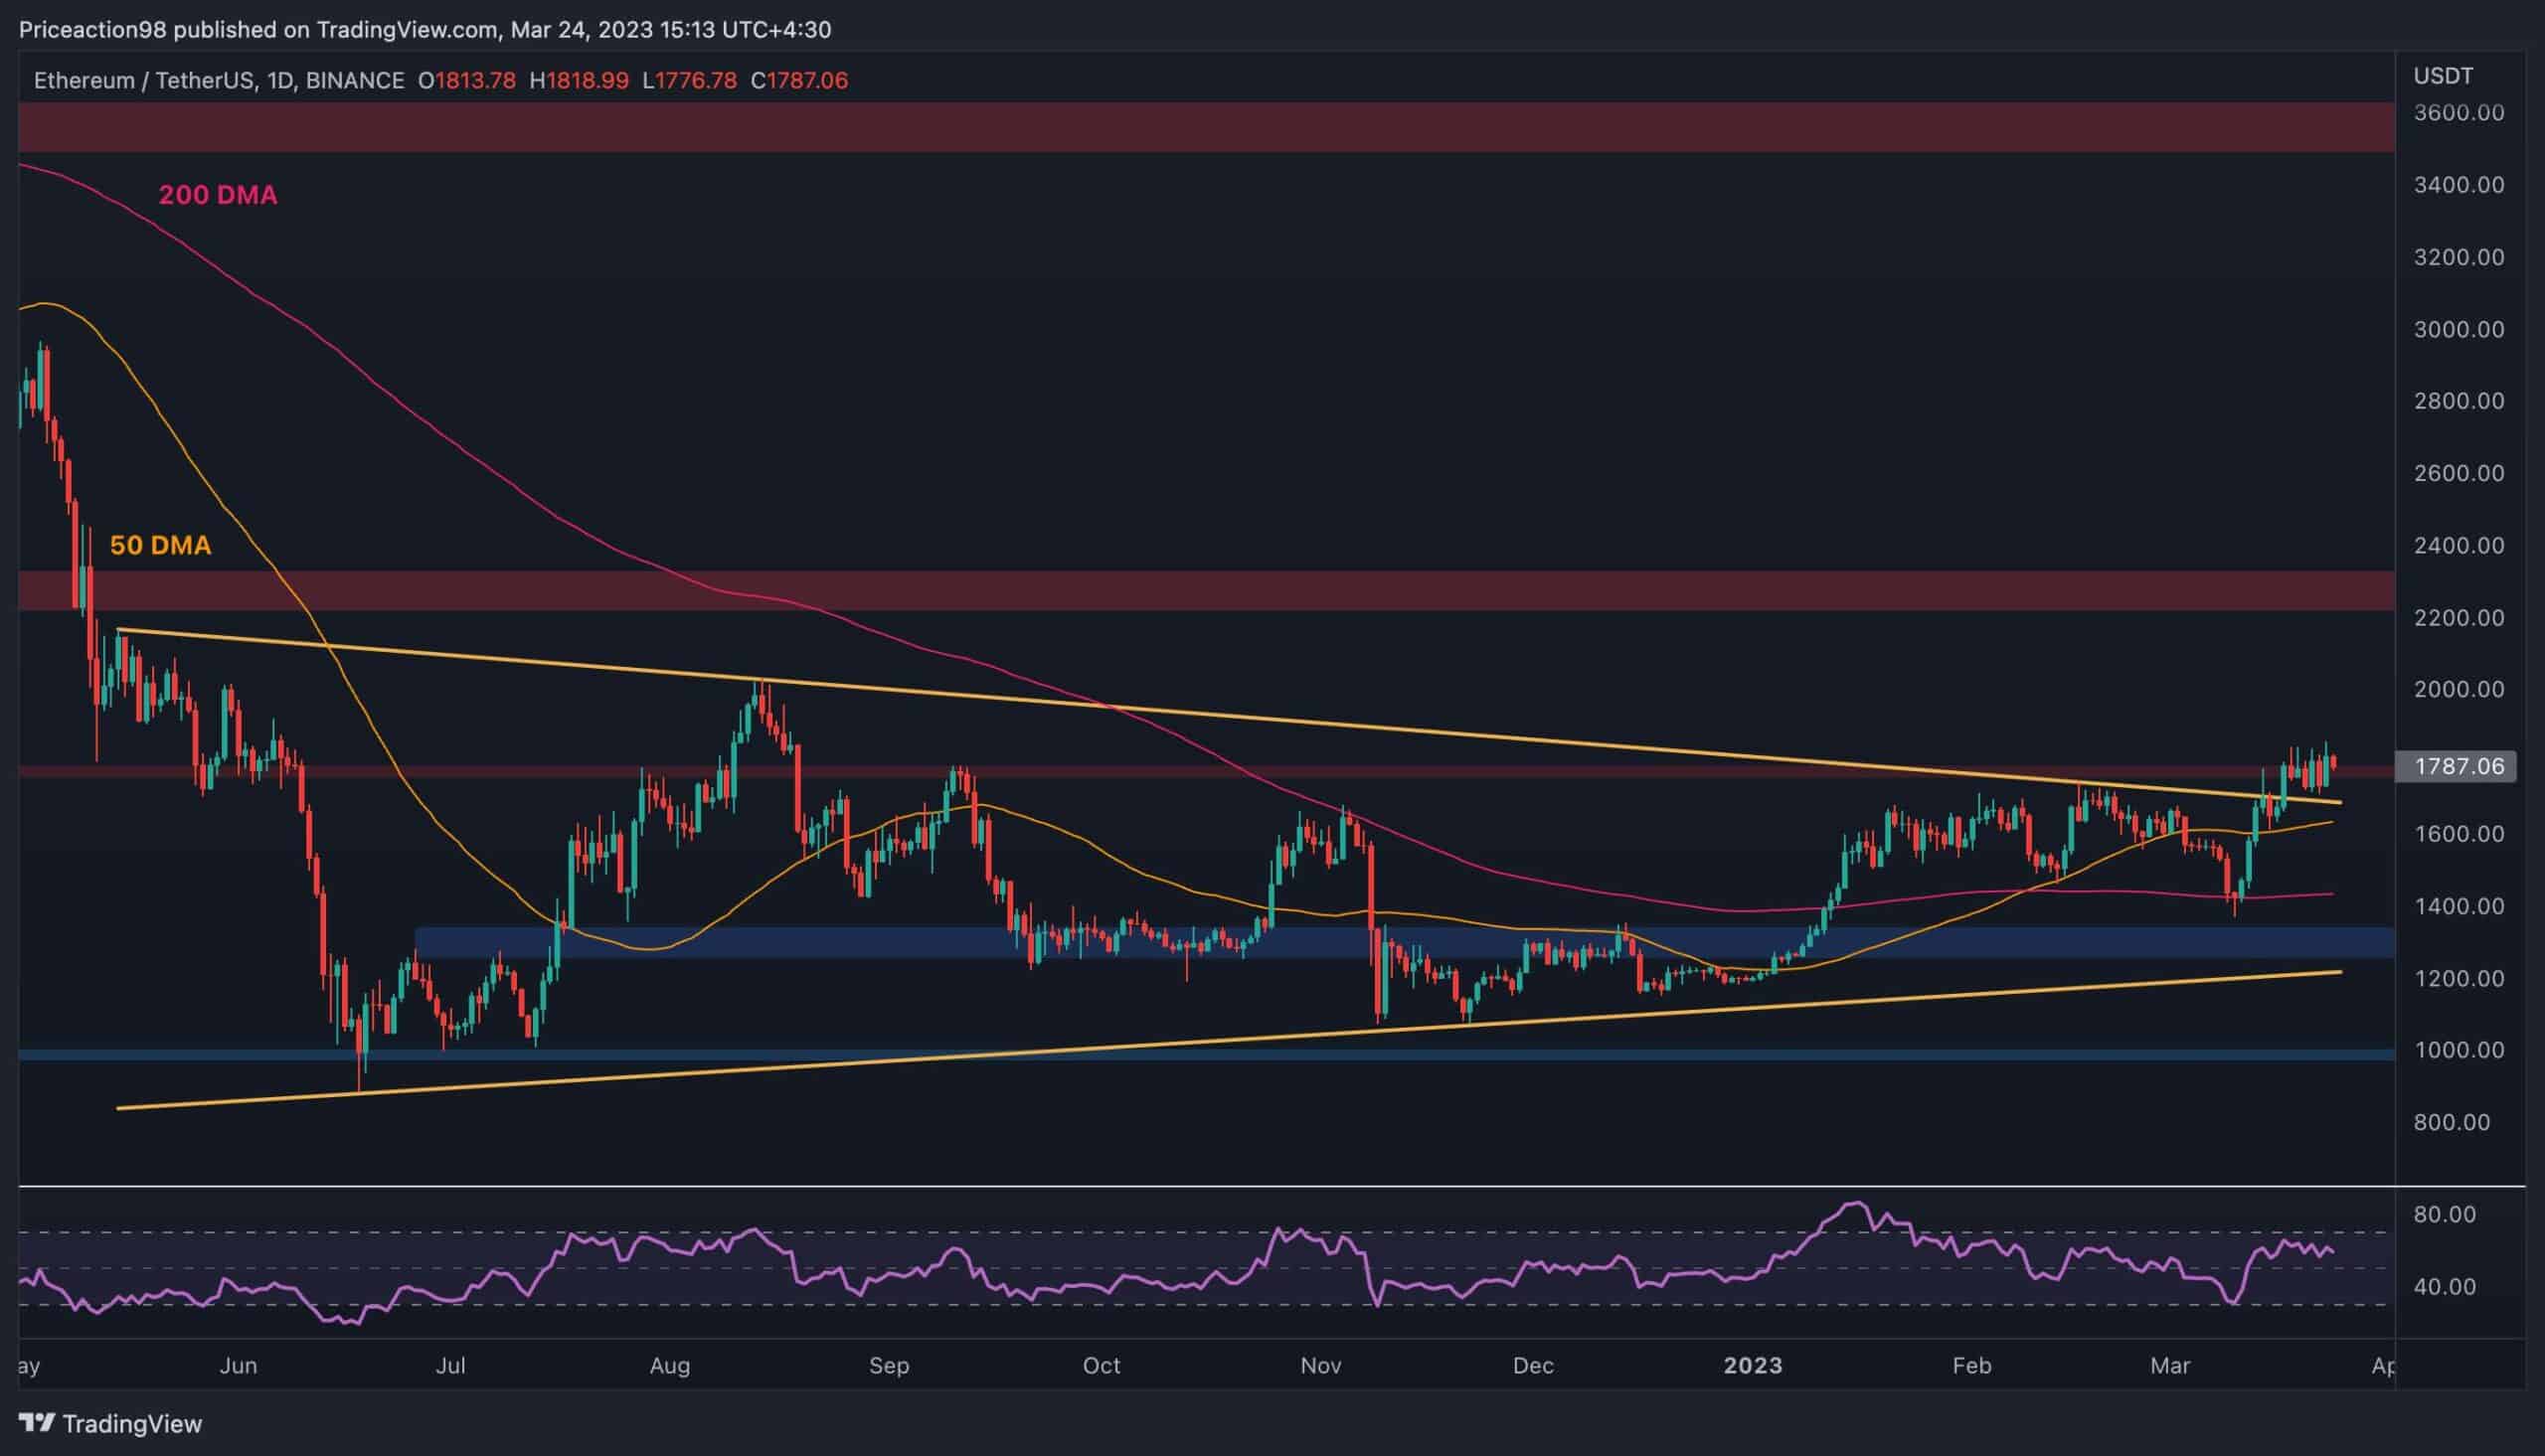
The Daily Chart:
On the daily time frame, ETH’s price has broken above the symmetrical triangle pattern lately and above the 50-day moving average line (around the $1600 mark). However, ETH is trading inside a very tight range above the broken triangle and has yet to break with confidence above the $1800 level.
If the market fails, a pullback toward the 50-day and even the 200-day moving average located around the $1600 and $1400 levels, respectively, could be expected. On the other hand, a valid break above the $1800 level could lead to another short-term rally – first to target the $2K level for the first time in 2023, and then a further target amind the $2300 area.
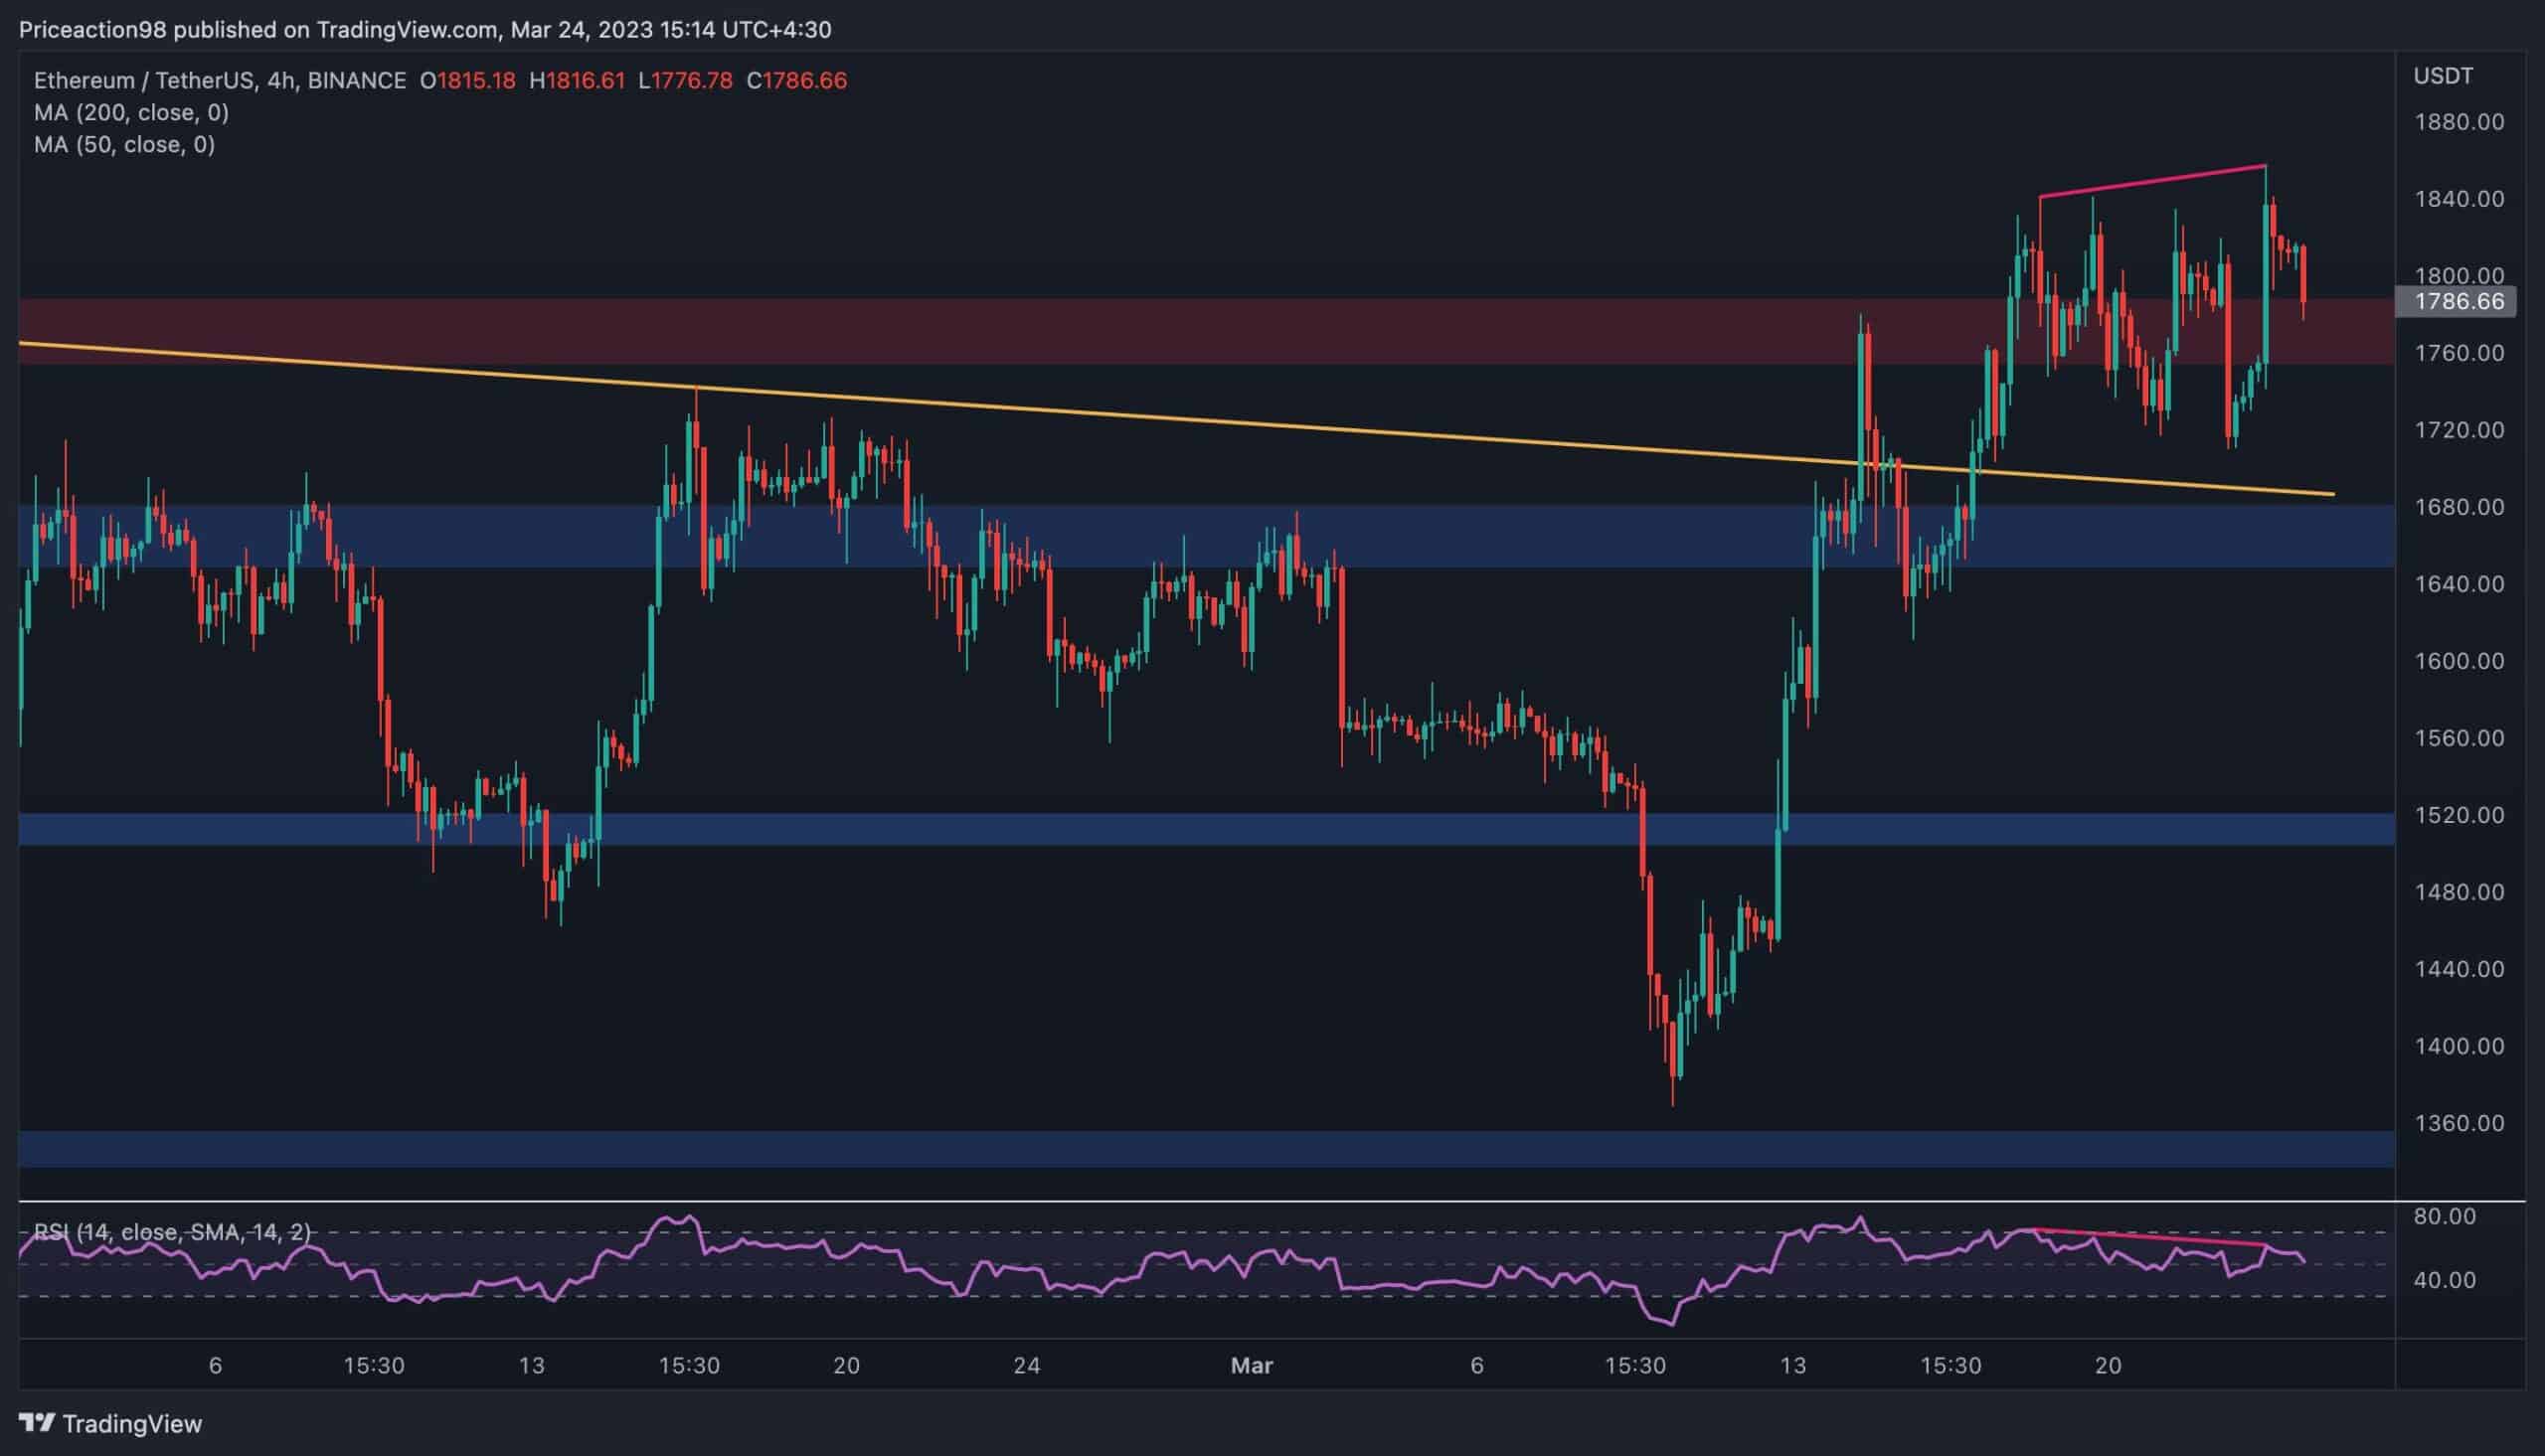
The 4-Hour Chart
On the 4-hour chart, the consolidation becomes more evident, as the price has been bouncing around the $1800 resistance level. The RSI indicator has been indicating a clear bearish divergence signal for a while, which could point to a pullback in the coming days.
In this case, the $1650 level could be retested as support, followed by the $1500 level. However, it is still too soon to predict whether the bullish trend will continue or reverse, as the market has yet to decide amid the $1800 resistance.
On-Chain Analysis
By: Edris
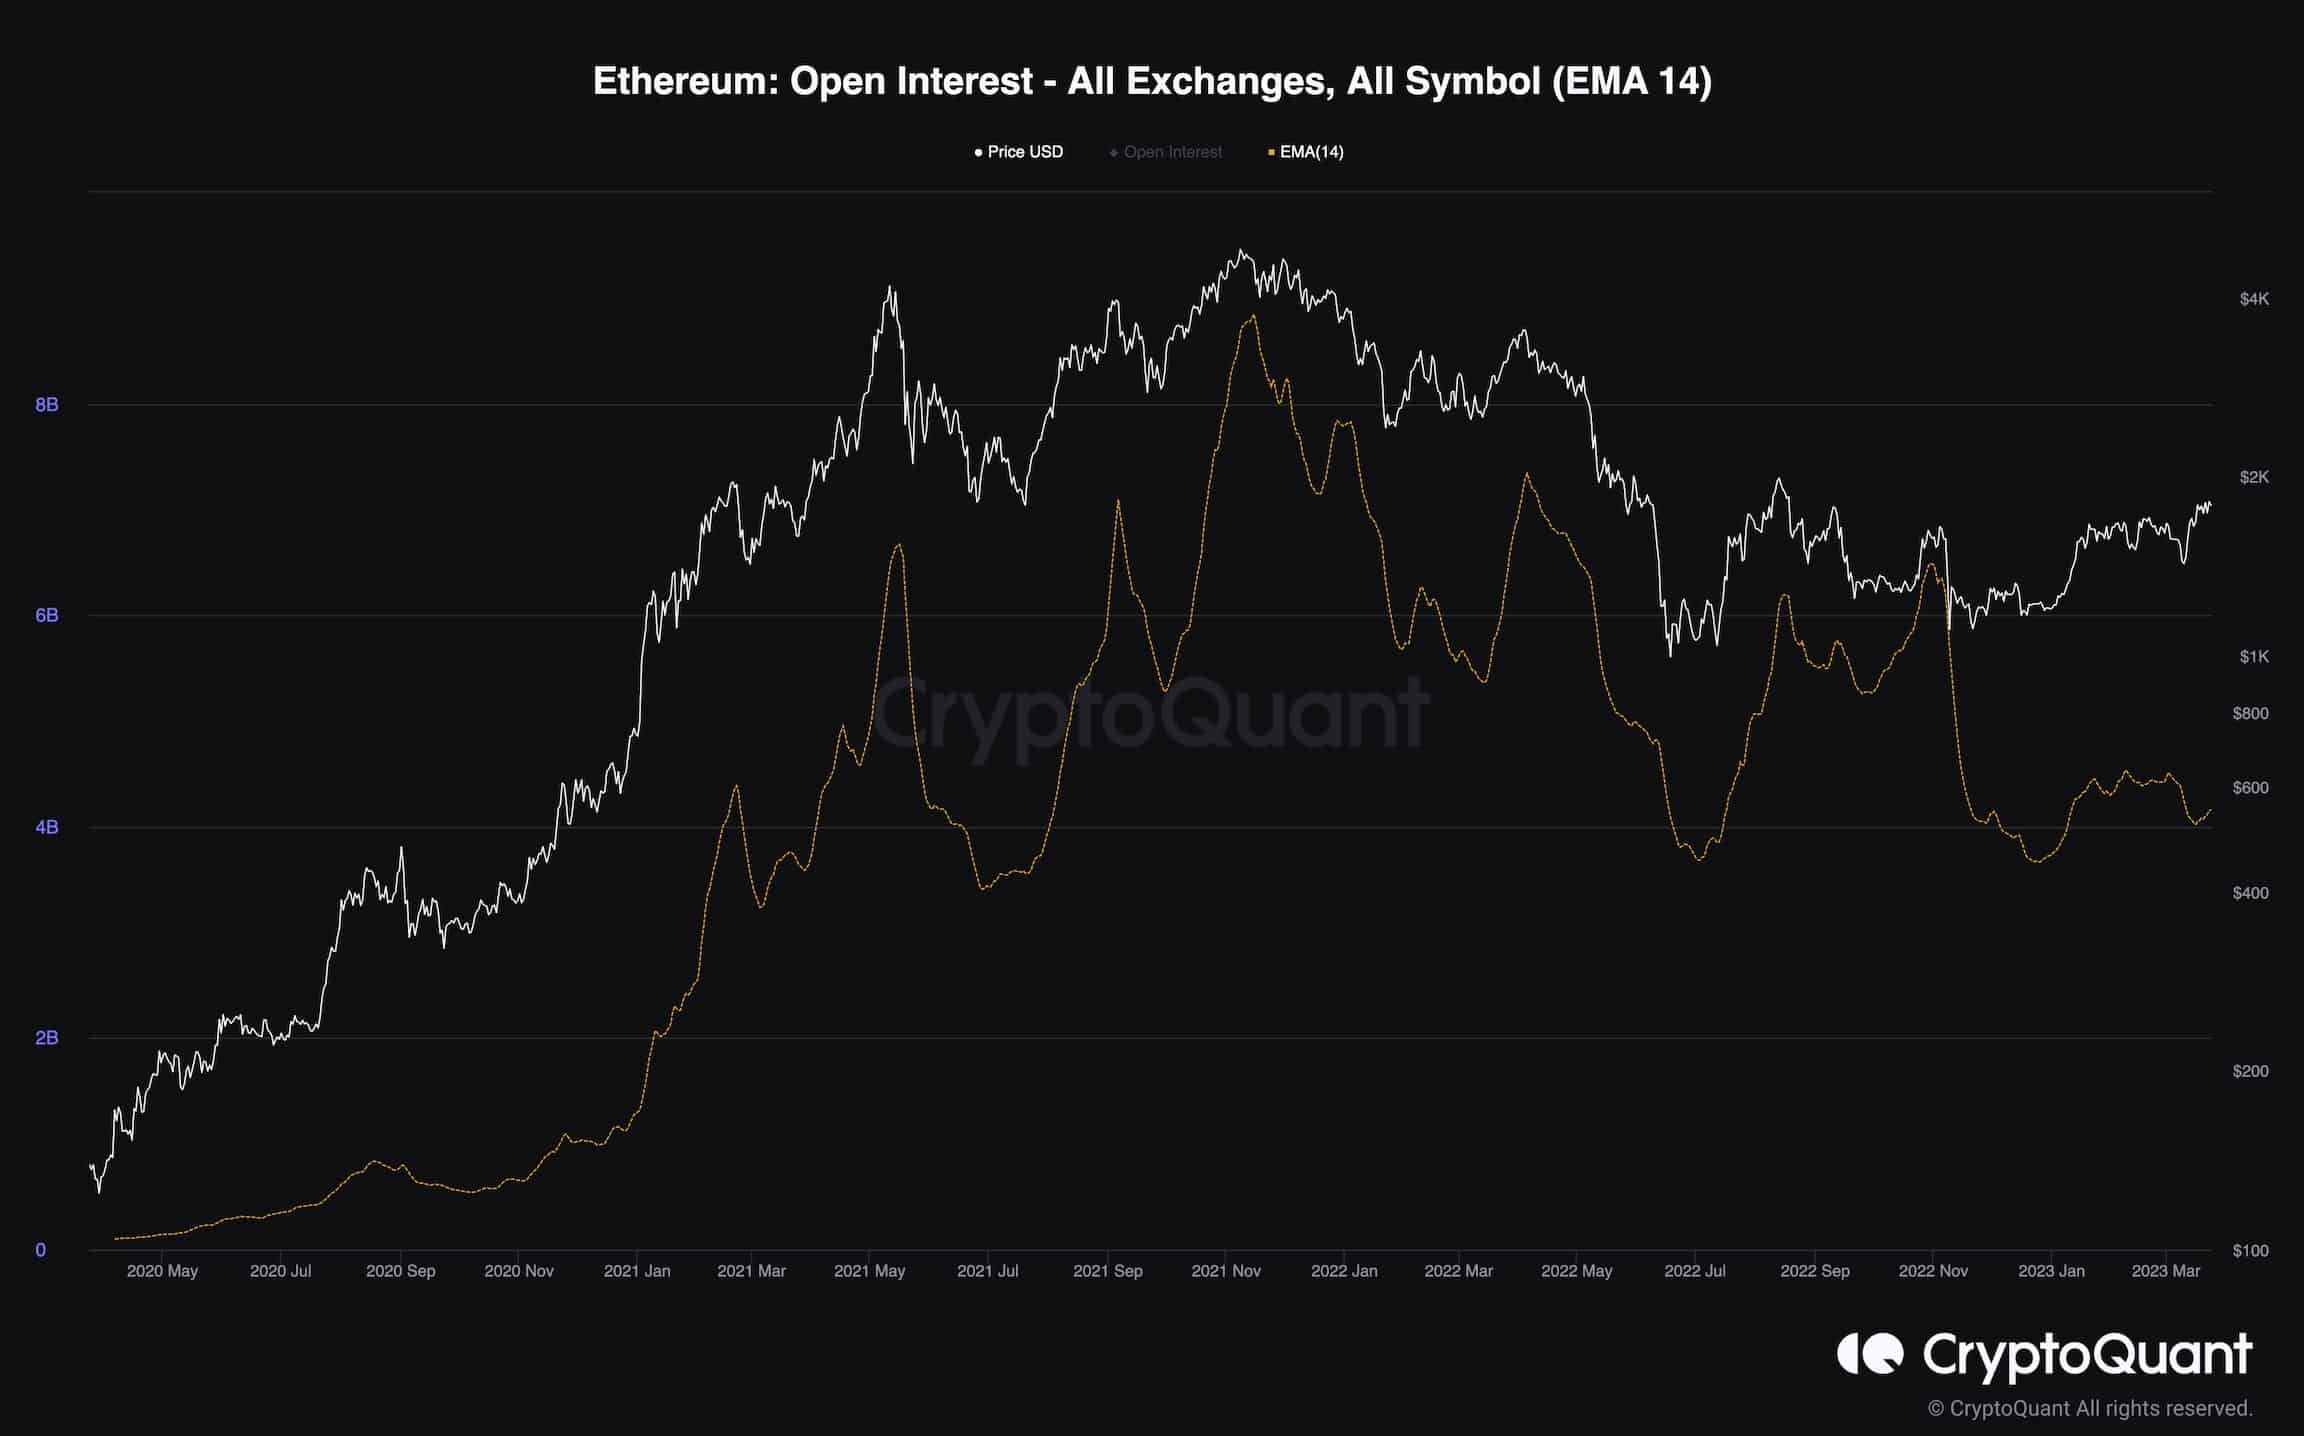
Ethereum Open Interest
Ethereum’s price has steadily climbed over the last few months, following a reversal around the $1000 support mark. However, the futures market behaves quite differently from the previous few times when the market experienced short-term rallies during the recent bear market.
The open interest metric (OI) measures the daily number of open futures contracts and is a handy indicator for evaluating the futures market sentiment. Generally, rising open interests are followed by high volatility and bearish reversals. However, the open interest has remained relatively low during the recent rally.
As a result, the uptrend could still be sustained as there is a lower chance of long liquidation cascades occurring in the short term. Note – the spot market should also be considered in order to make more precise predictions.