Ripple went through a considerable increase, but its upward trend slowed down upon reaching the critical resistance level of %excerpt%.58. Nevertheless, it appears to have a bullish perspective on the weekly timeframe. Technical Analysis By Shayan The Weekly Chart After a significant spike, XRP has successfully broken through the multi-year descending trendline, a key level on the weekly timeframe, providing a positive market sentiment. However, the price now faces two substantial barriers: the %excerpt%.53-%excerpt%.58 range and the 100-week moving average positioned at %excerpt%.63. If XRP manages to surpass the %excerpt%.53-%excerpt%.58 zone, a rally toward the 100-week moving average becomes likely. Conversely, if the price fails to break above this range, the descending trendline will serve as Ripple’s
Topics:
CryptoVizArt considers the following as important: Ripple (XRP) Price, XRP Analysis, xrpbtc, xrpusd
This could be interesting, too:
Jordan Lyanchev writes Ripple’s (XRP) Surge to Triggers Over Million in Short Liquidations
Jordan Lyanchev writes Trump Confirms Work on Strategic Crypto Reserve: XRP, ADA, SOL Included
Dimitar Dzhondzhorov writes Is a Major Ripple v. SEC Lawsuit Development Expected This Week? Here’s Why
Mandy Williams writes Ripple Releases Institutional DeFi Roadmap for XRP Ledger in 2025
Ripple went through a considerable increase, but its upward trend slowed down upon reaching the critical resistance level of $0.58. Nevertheless, it appears to have a bullish perspective on the weekly timeframe.
Technical Analysis
By Shayan
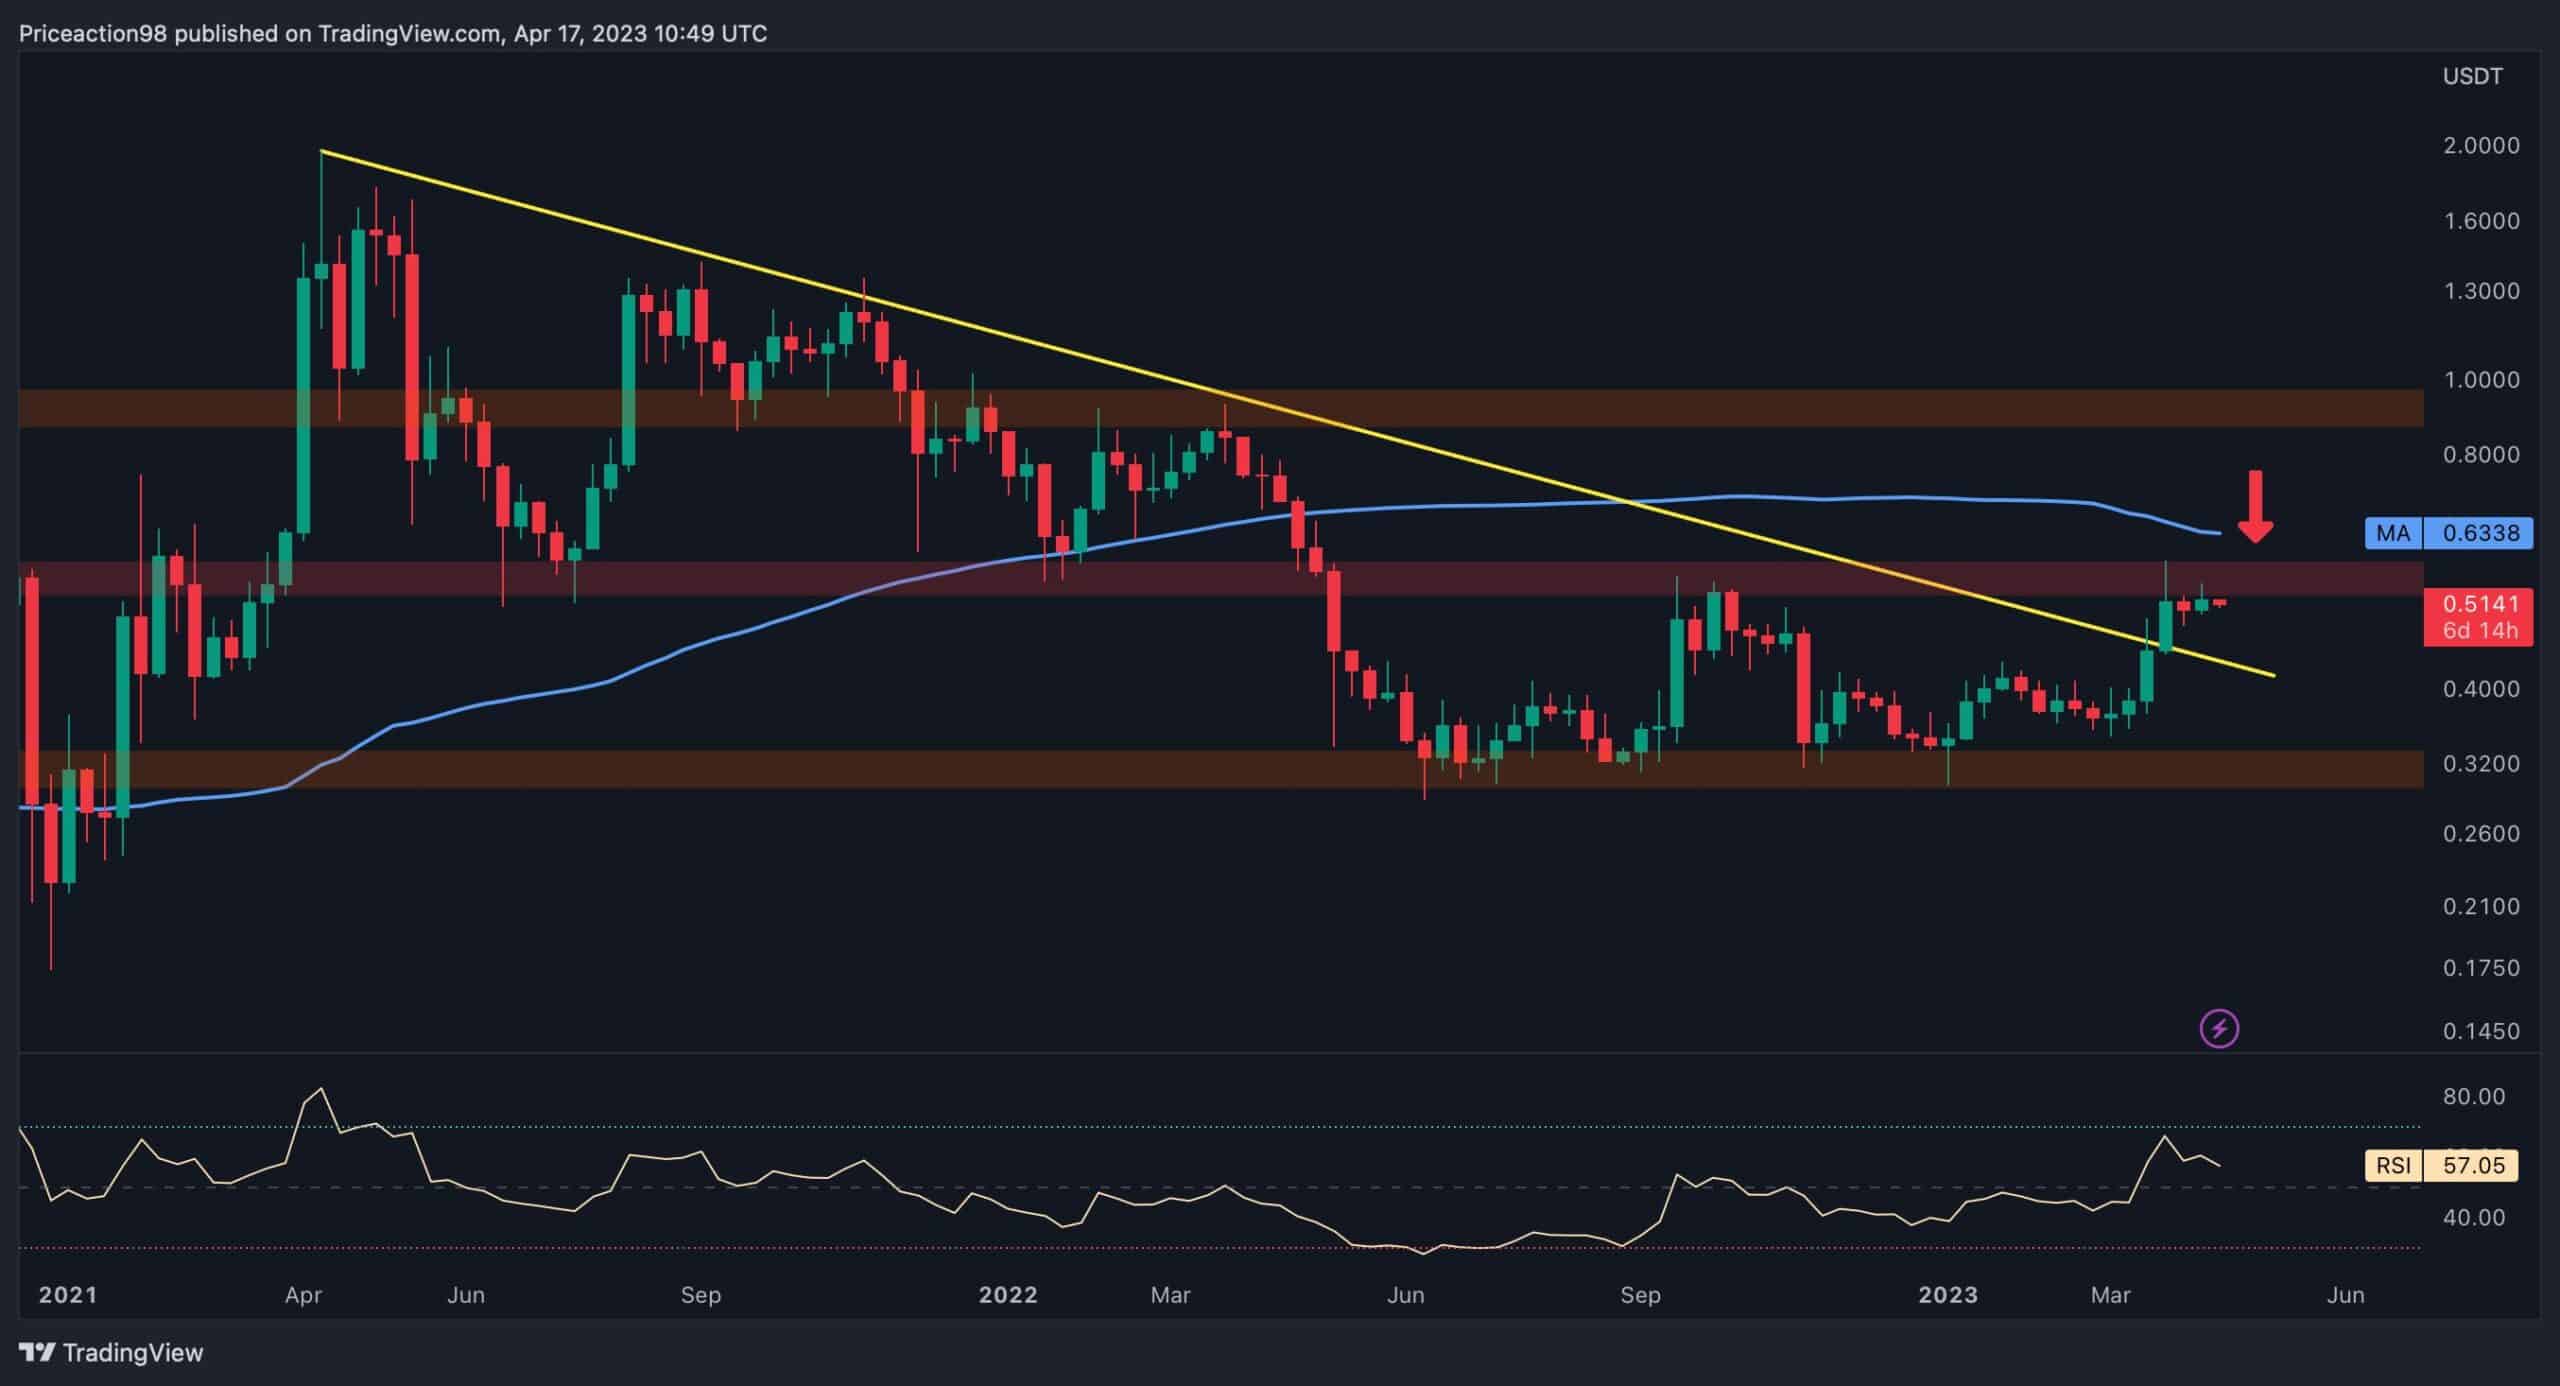
The Weekly Chart
After a significant spike, XRP has successfully broken through the multi-year descending trendline, a key level on the weekly timeframe, providing a positive market sentiment.
However, the price now faces two substantial barriers: the $0.53-$0.58 range and the 100-week moving average positioned at $0.63.
If XRP manages to surpass the $0.53-$0.58 zone, a rally toward the 100-week moving average becomes likely. Conversely, if the price fails to break above this range, the descending trendline will serve as Ripple’s primary support level.
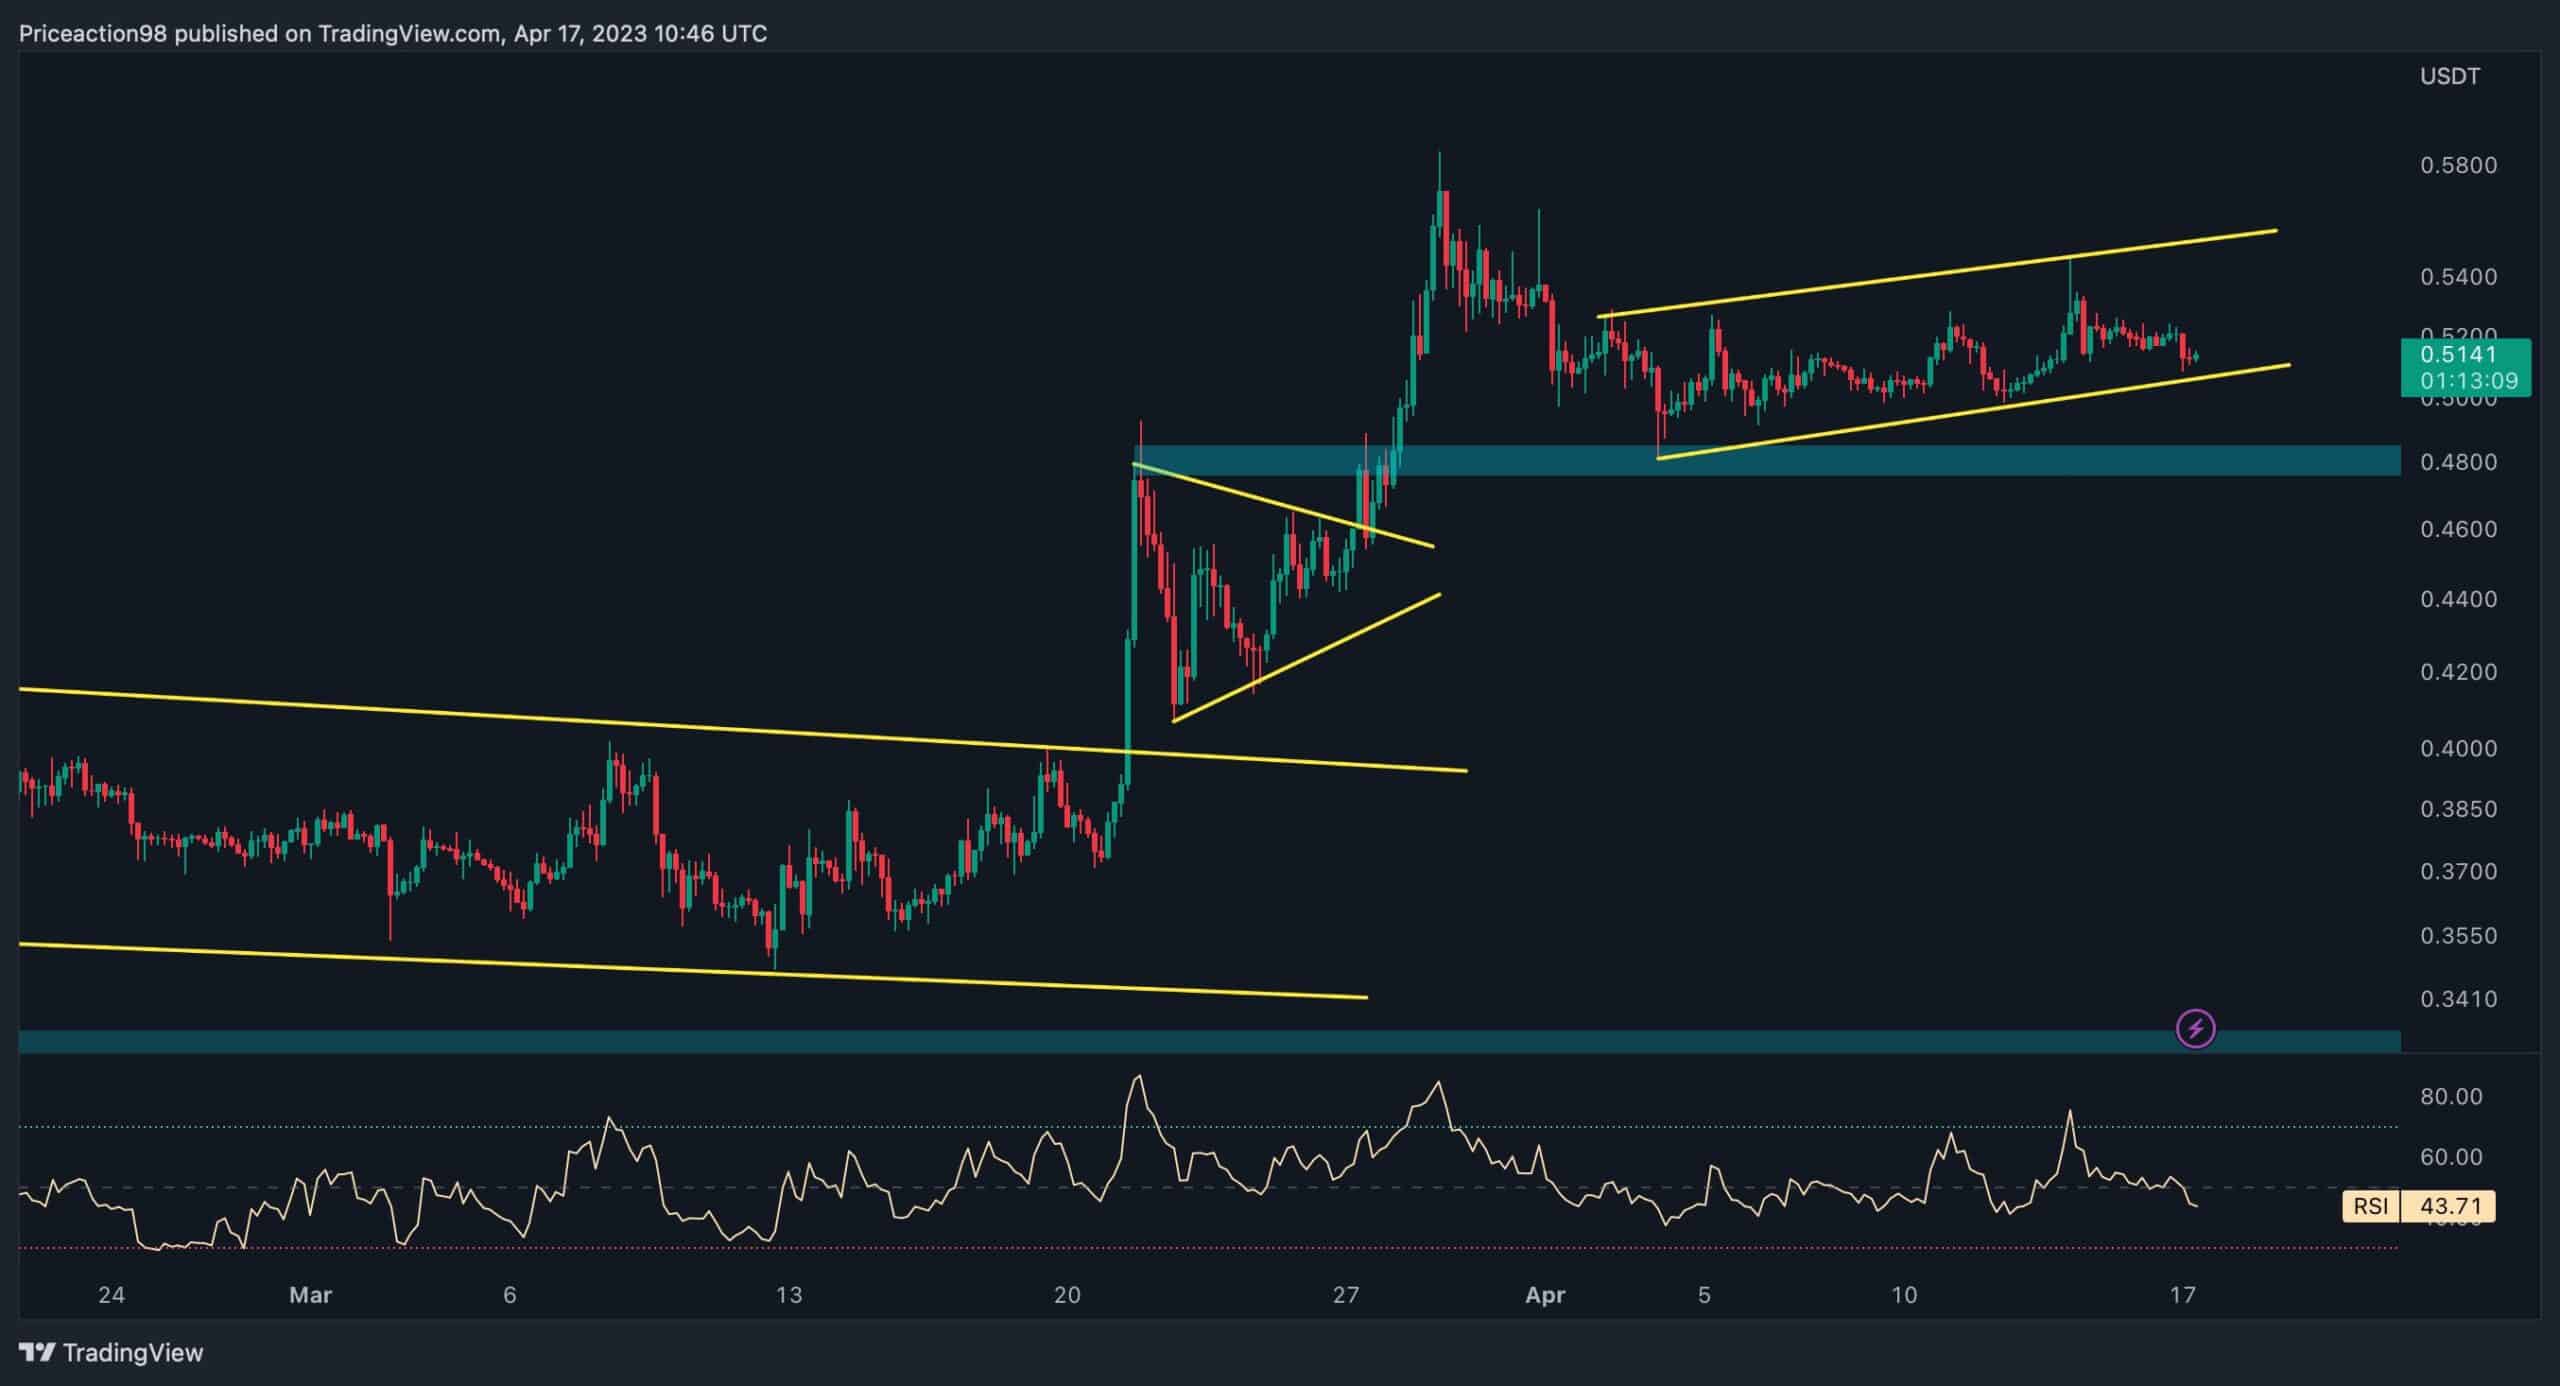
The 4-Hour Chart
XRP’s price attempted to break the $0.58 level but was met with resistance, resulting in a reversal and a steady decline. However, after falling to $0.48, it entered a consolidation phase with low volatility.
During this period, the price formed an ascending flag pattern and is currently testing the lower threshold. Presently, XRP faces two crucial support levels: the $0.48 minor support and the flag’s lower trendline.
In summary, if the price drops below the lower trendline, the minor $0.48 zone will become Ripple’s primary support in the 4-hour timeframe. Conversely, if Ripple can achieve another significant surge and break past the $0.58 resistance level, it could trigger an extended bullish rally toward the $0.63 zone.