After a sudden surge, Ripple’s price has reached a critical resistance region, which represents its previous major swing high formed in late April. However, after such an explosive move, it’s typical for the price to enter into consolidation. Technical Analysis By Shayan The Daily Chart Upon analyzing the daily chart, it becomes evident that Ripple experienced a significant price jump after finding support at the 100-day moving average. However, it now confronts a significant resistance zone at %excerpt%.85, marked by substantial selling pressure. This development indicates a bullish sentiment among Ripple traders. Nevertheless, it’s important to acknowledge that a consolidation correction stage is essential following impulsive price surges to confirm the strength of the trend
Topics:
CryptoVizArt considers the following as important: Ripple (XRP) Price, XRP Analysis, xrpbtc, xrpusd
This could be interesting, too:
Jordan Lyanchev writes Ripple’s (XRP) Surge to Triggers Over Million in Short Liquidations
Jordan Lyanchev writes Trump Confirms Work on Strategic Crypto Reserve: XRP, ADA, SOL Included
Dimitar Dzhondzhorov writes Is a Major Ripple v. SEC Lawsuit Development Expected This Week? Here’s Why
Mandy Williams writes Ripple Releases Institutional DeFi Roadmap for XRP Ledger in 2025
After a sudden surge, Ripple’s price has reached a critical resistance region, which represents its previous major swing high formed in late April. However, after such an explosive move, it’s typical for the price to enter into consolidation.
Technical Analysis
By Shayan
The Daily Chart
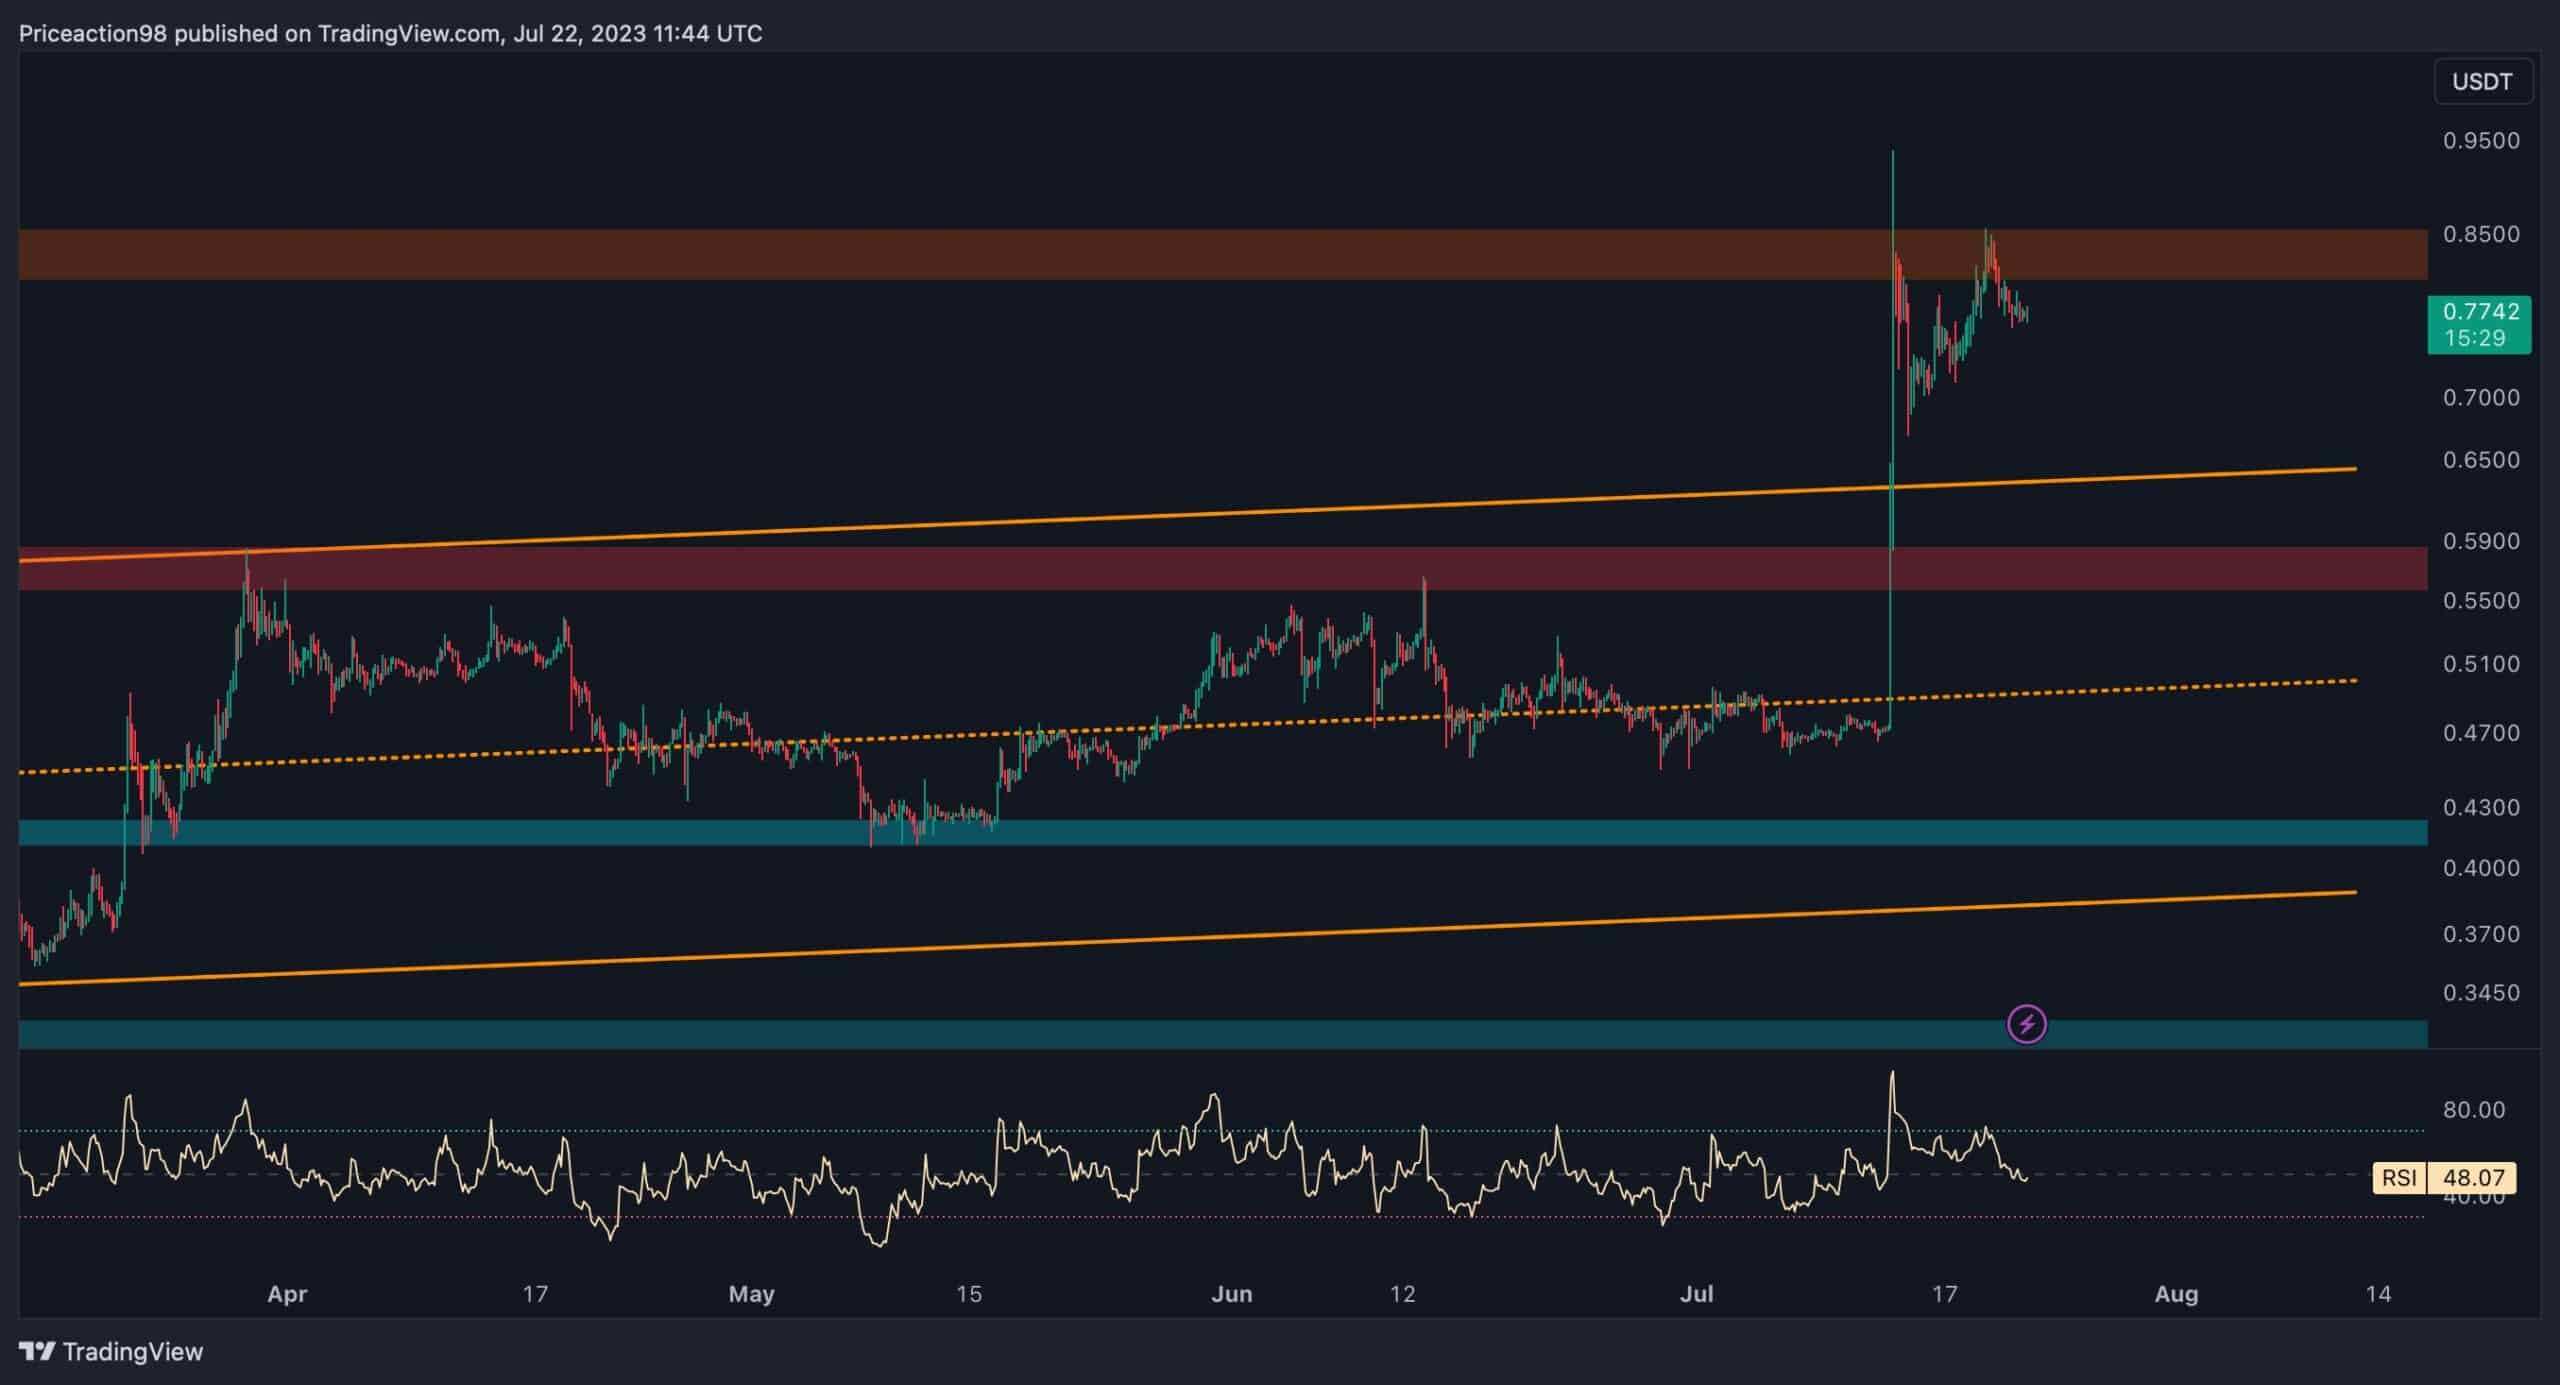
Upon analyzing the daily chart, it becomes evident that Ripple experienced a significant price jump after finding support at the 100-day moving average. However, it now confronts a significant resistance zone at $0.85, marked by substantial selling pressure.
This development indicates a bullish sentiment among Ripple traders. Nevertheless, it’s important to acknowledge that a consolidation correction stage is essential following impulsive price surges to confirm the strength of the trend and let the market rest for a while.
Hence, it is expected that the price will enter a short-term correction phase, leading to higher volatility and pullback legs before the next notable upward movement takes place.
The 4-Hour Chart
The 4-hour chart reveals that the price has successfully broken above the upper edge of a channel, evident from a large green candle resulting from a recent explosive rally. Nonetheless, a pullback to the broken level is required to validate the breakout.
Therefore, based on the price action, it seems likely that the price will undergo a correction period, retracing back to the upper boundary and completing a pullback. Consequently, if successful, the market can anticipate continuing the bullish rally, pushing the price to higher regions.
However, in the event of a decline below the channel’s upper boundary, the static support at $0.56 will become Ripple’s next target.