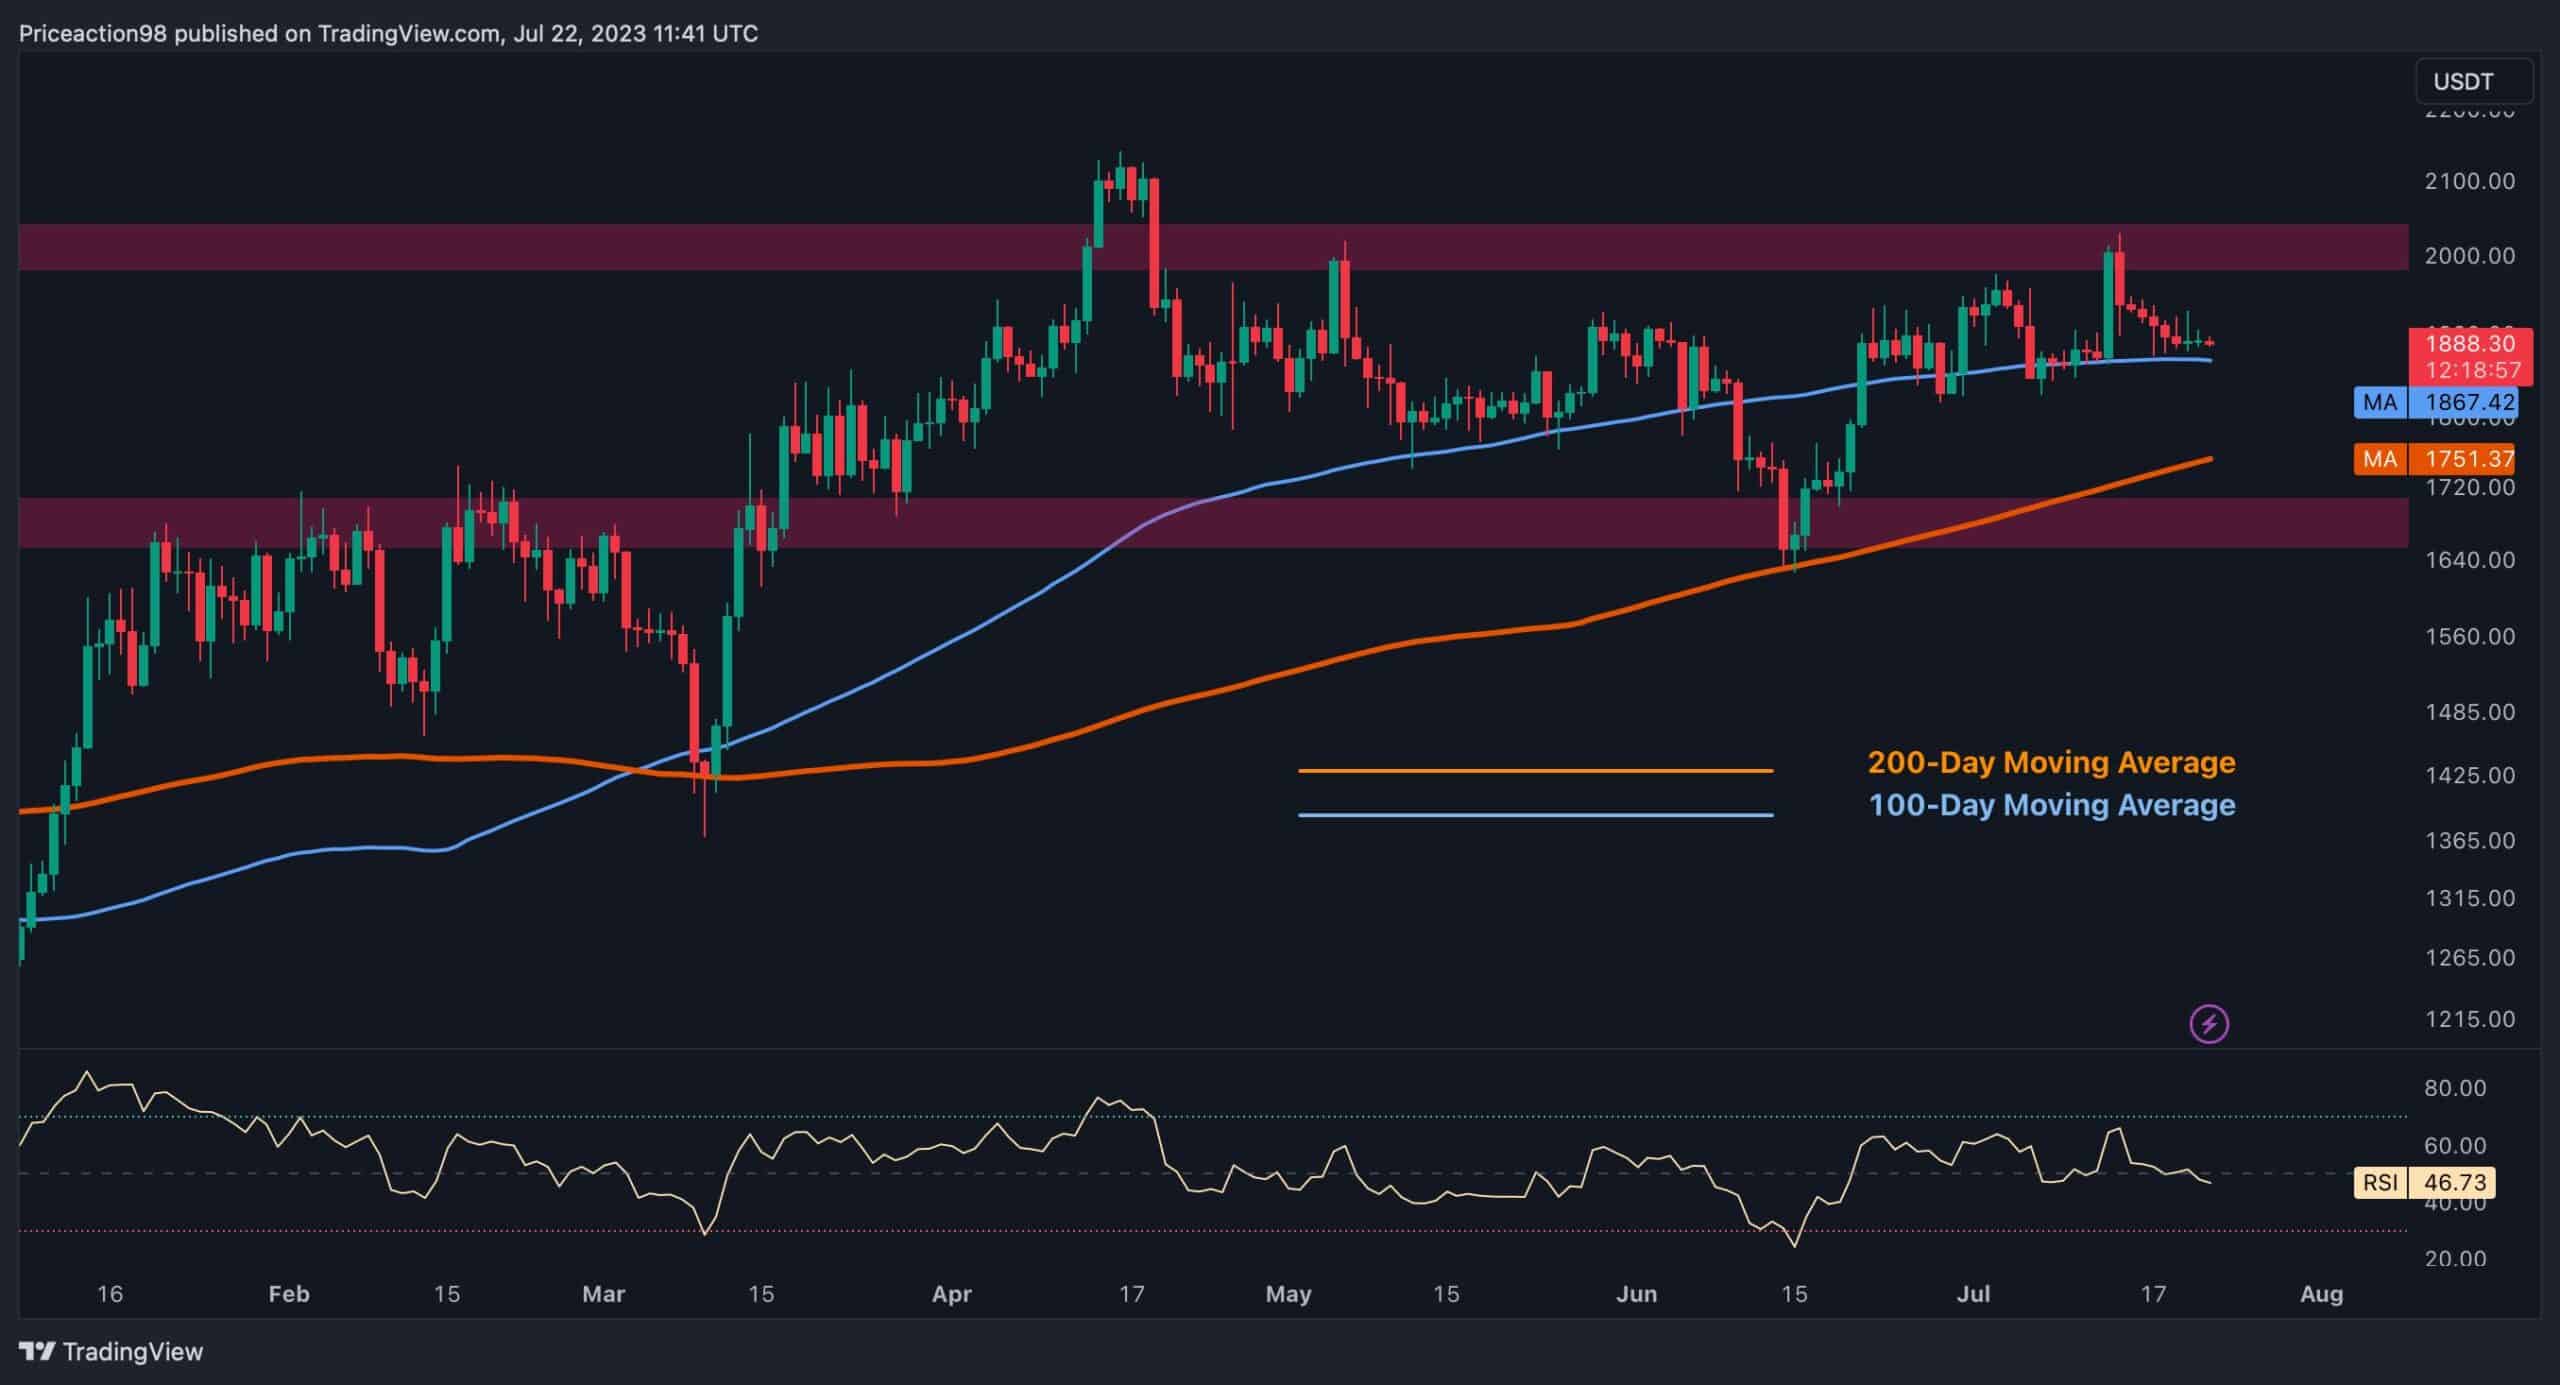
Ethereum buyers have been struggling to push the price above the significant resistance region of K. Nevertheless, the price is currently navigating a crucial range bounded by that level and the dynamic support provided by the 100-day moving average. Technical Analysis By Shayan The Daily Chart On June 21st, Ethereum managed to surpass the 100-day moving average and continued its prevailing uptrend after a pullback, eventually reaching the critical resistance area at K. Yet, the bullish momentum faded due to increased selling pressure around this level, resulting in minor rejections. Nevertheless, the price finds support at the 100-day MA, currently situated at ,867, which has prevented further declines over the past few weeks. A breakout from this significant price
Topics:
CryptoVizArt considers the following as important: ETH Analysis, ETHBTC, Ethereum (ETH) Price, ethusd
This could be interesting, too:
Mandy Williams writes Ethereum Derivatives Metrics Signal Modest Downside Tail Risk Ahead: Nansen
Jordan Lyanchev writes Weekly Bitcoin, Ethereum ETF Recap: Light at the End of the Tunnel for BTC
CryptoVizArt writes Will Weak Momentum Drive ETH to .5K? (Ethereum Price Analysis)
Jordan Lyanchev writes Bybit Hack Fallout: Arthur Hayes, Samson Mow Push for Ethereum Rollback
Ethereum buyers have been struggling to push the price above the significant resistance region of $2K. Nevertheless, the price is currently navigating a crucial range bounded by that level and the dynamic support provided by the 100-day moving average.
Technical Analysis
By Shayan
The Daily Chart
On June 21st, Ethereum managed to surpass the 100-day moving average and continued its prevailing uptrend after a pullback, eventually reaching the critical resistance area at $2K. Yet, the bullish momentum faded due to increased selling pressure around this level, resulting in minor rejections.
Nevertheless, the price finds support at the 100-day MA, currently situated at $1,867, which has prevented further declines over the past few weeks. A breakout from this significant price range will likely play a pivotal role in determining Ethereum’s overall prospects in the mid-term.
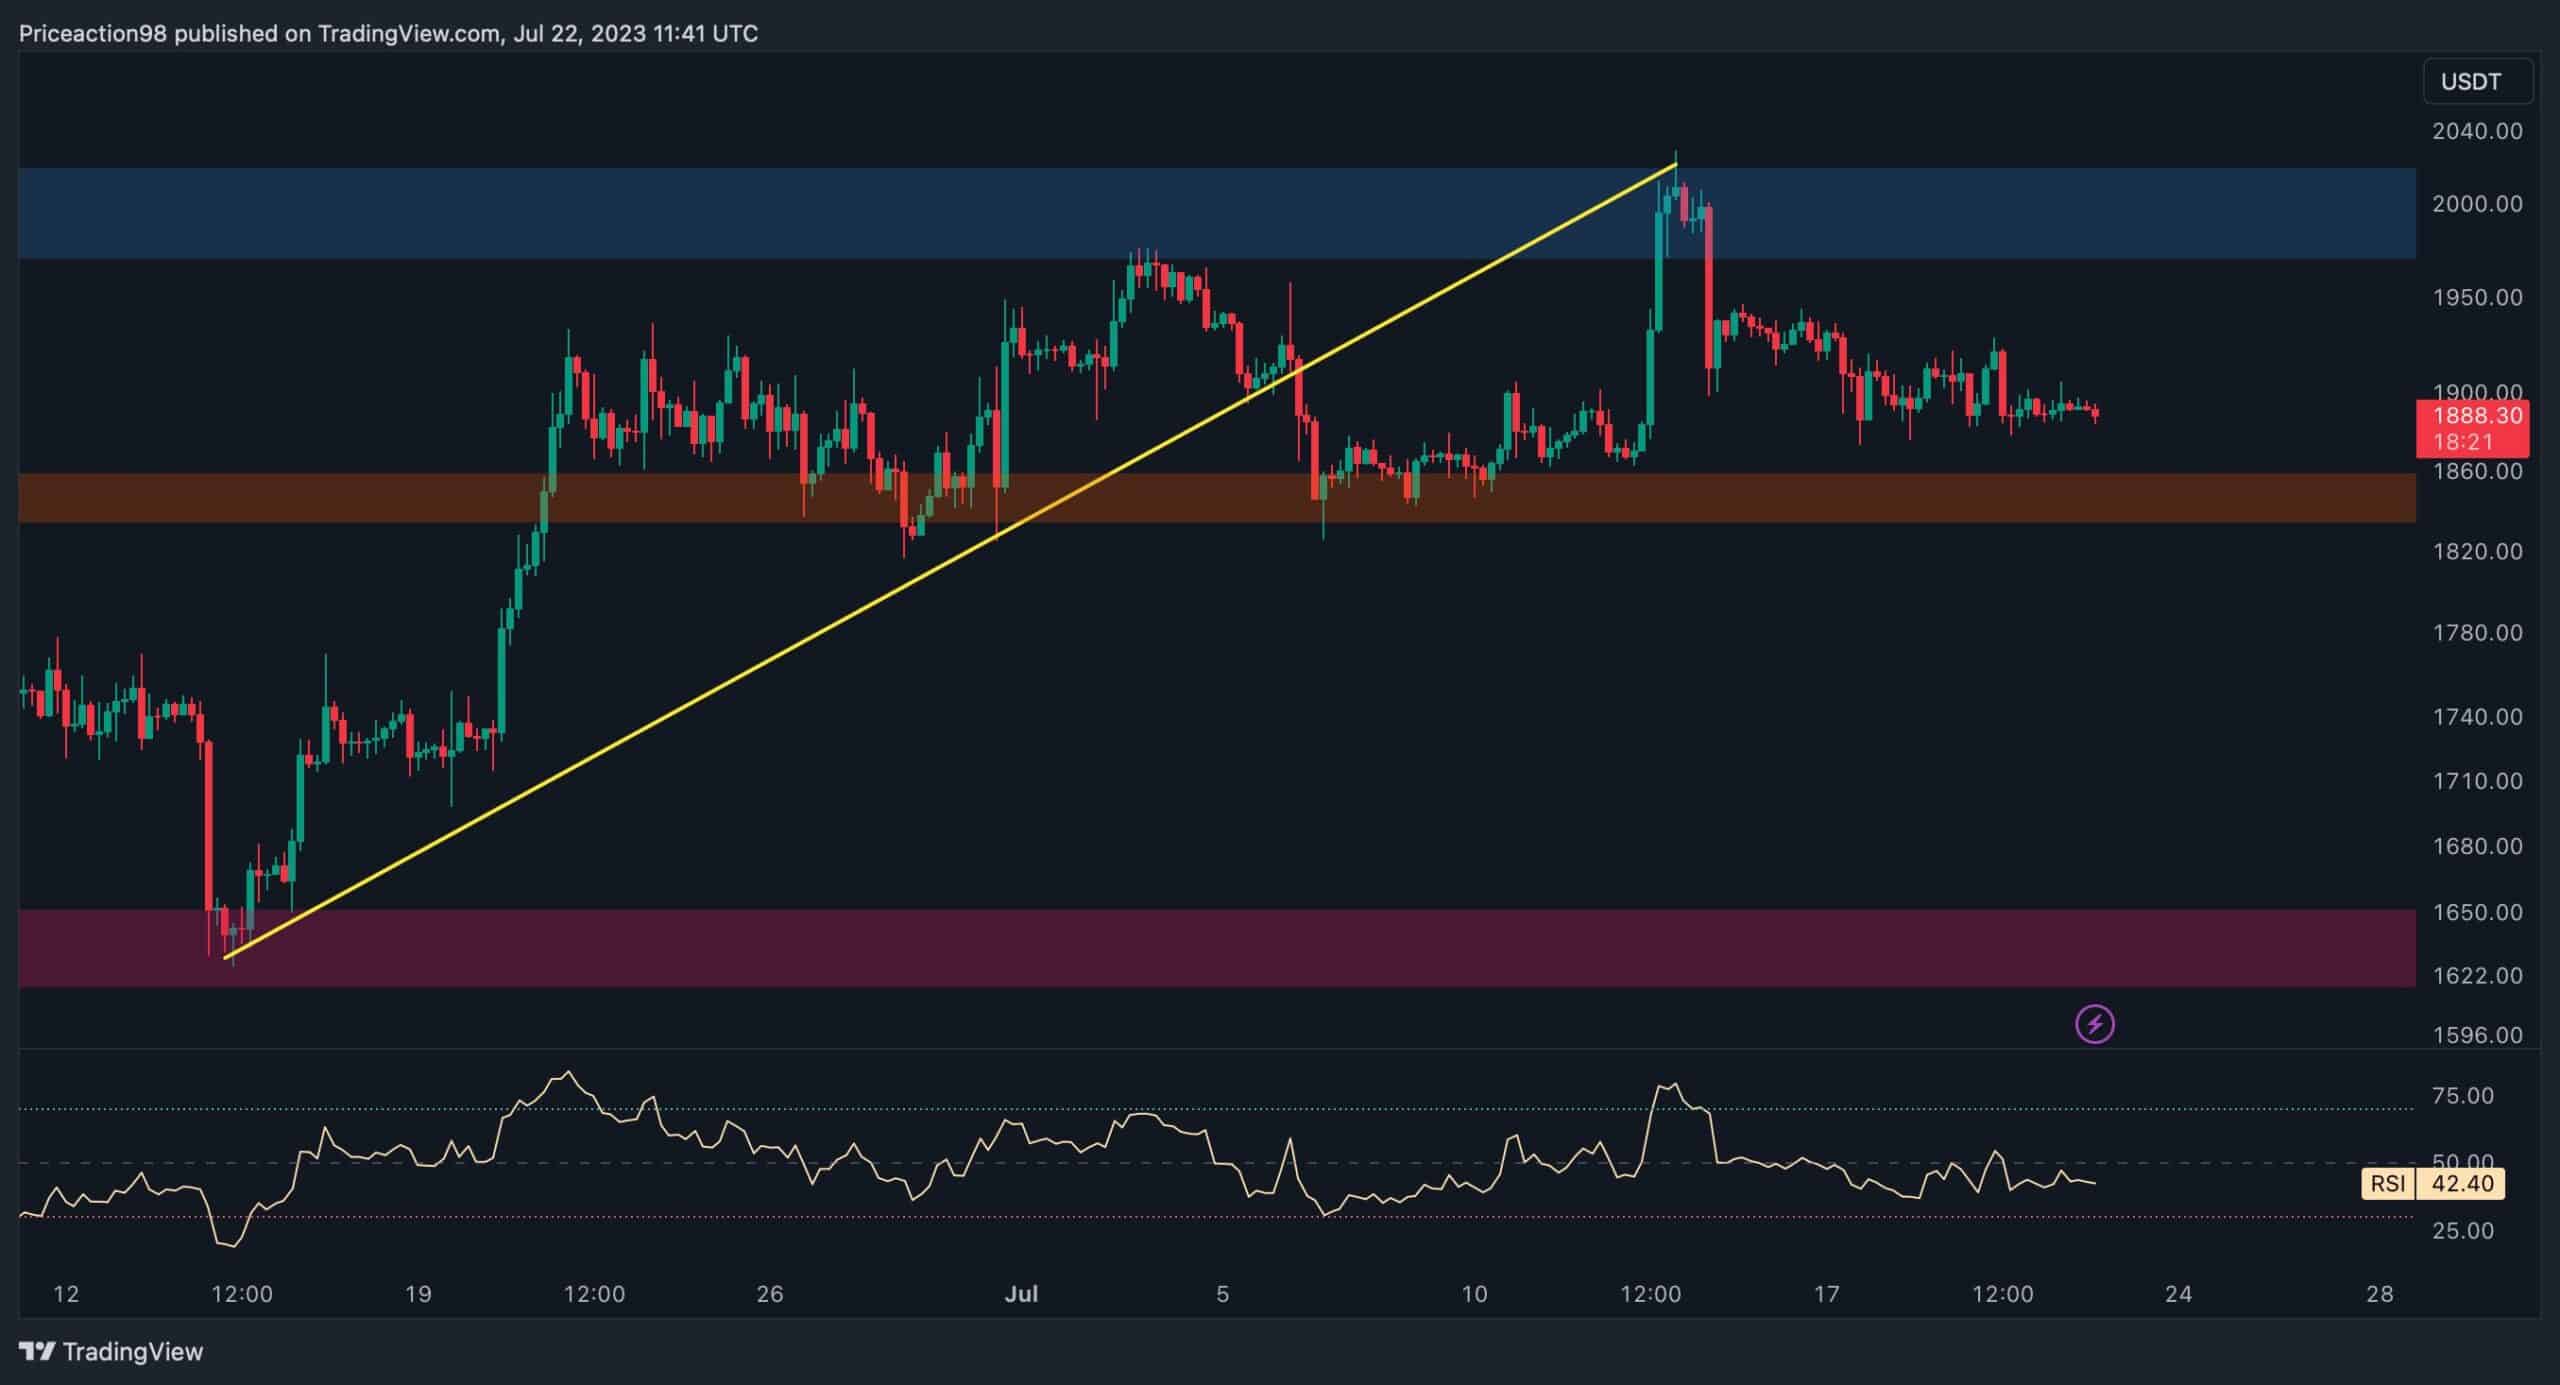
The 4-Hour Chart
Upon analyzing the 4-hour timeframe, a bearish trend for Ethereum becomes evident as the price broke below its multi-week upward trendline after facing rejection at the $2K resistance zone. A subsequent pullback confirmed the breakout.
At present, ETH remains confined between two critical price levels: the static resistance at $2K and the critical support at $1,850. This suggests the potential for a range-bound market stage characterized by consolidation candles and the absence of a strong trend.
The price is expected to remain within this range until a breakout occurs, revealing the upcoming direction for Ethereum.
On-chain Analysis
By Shayan
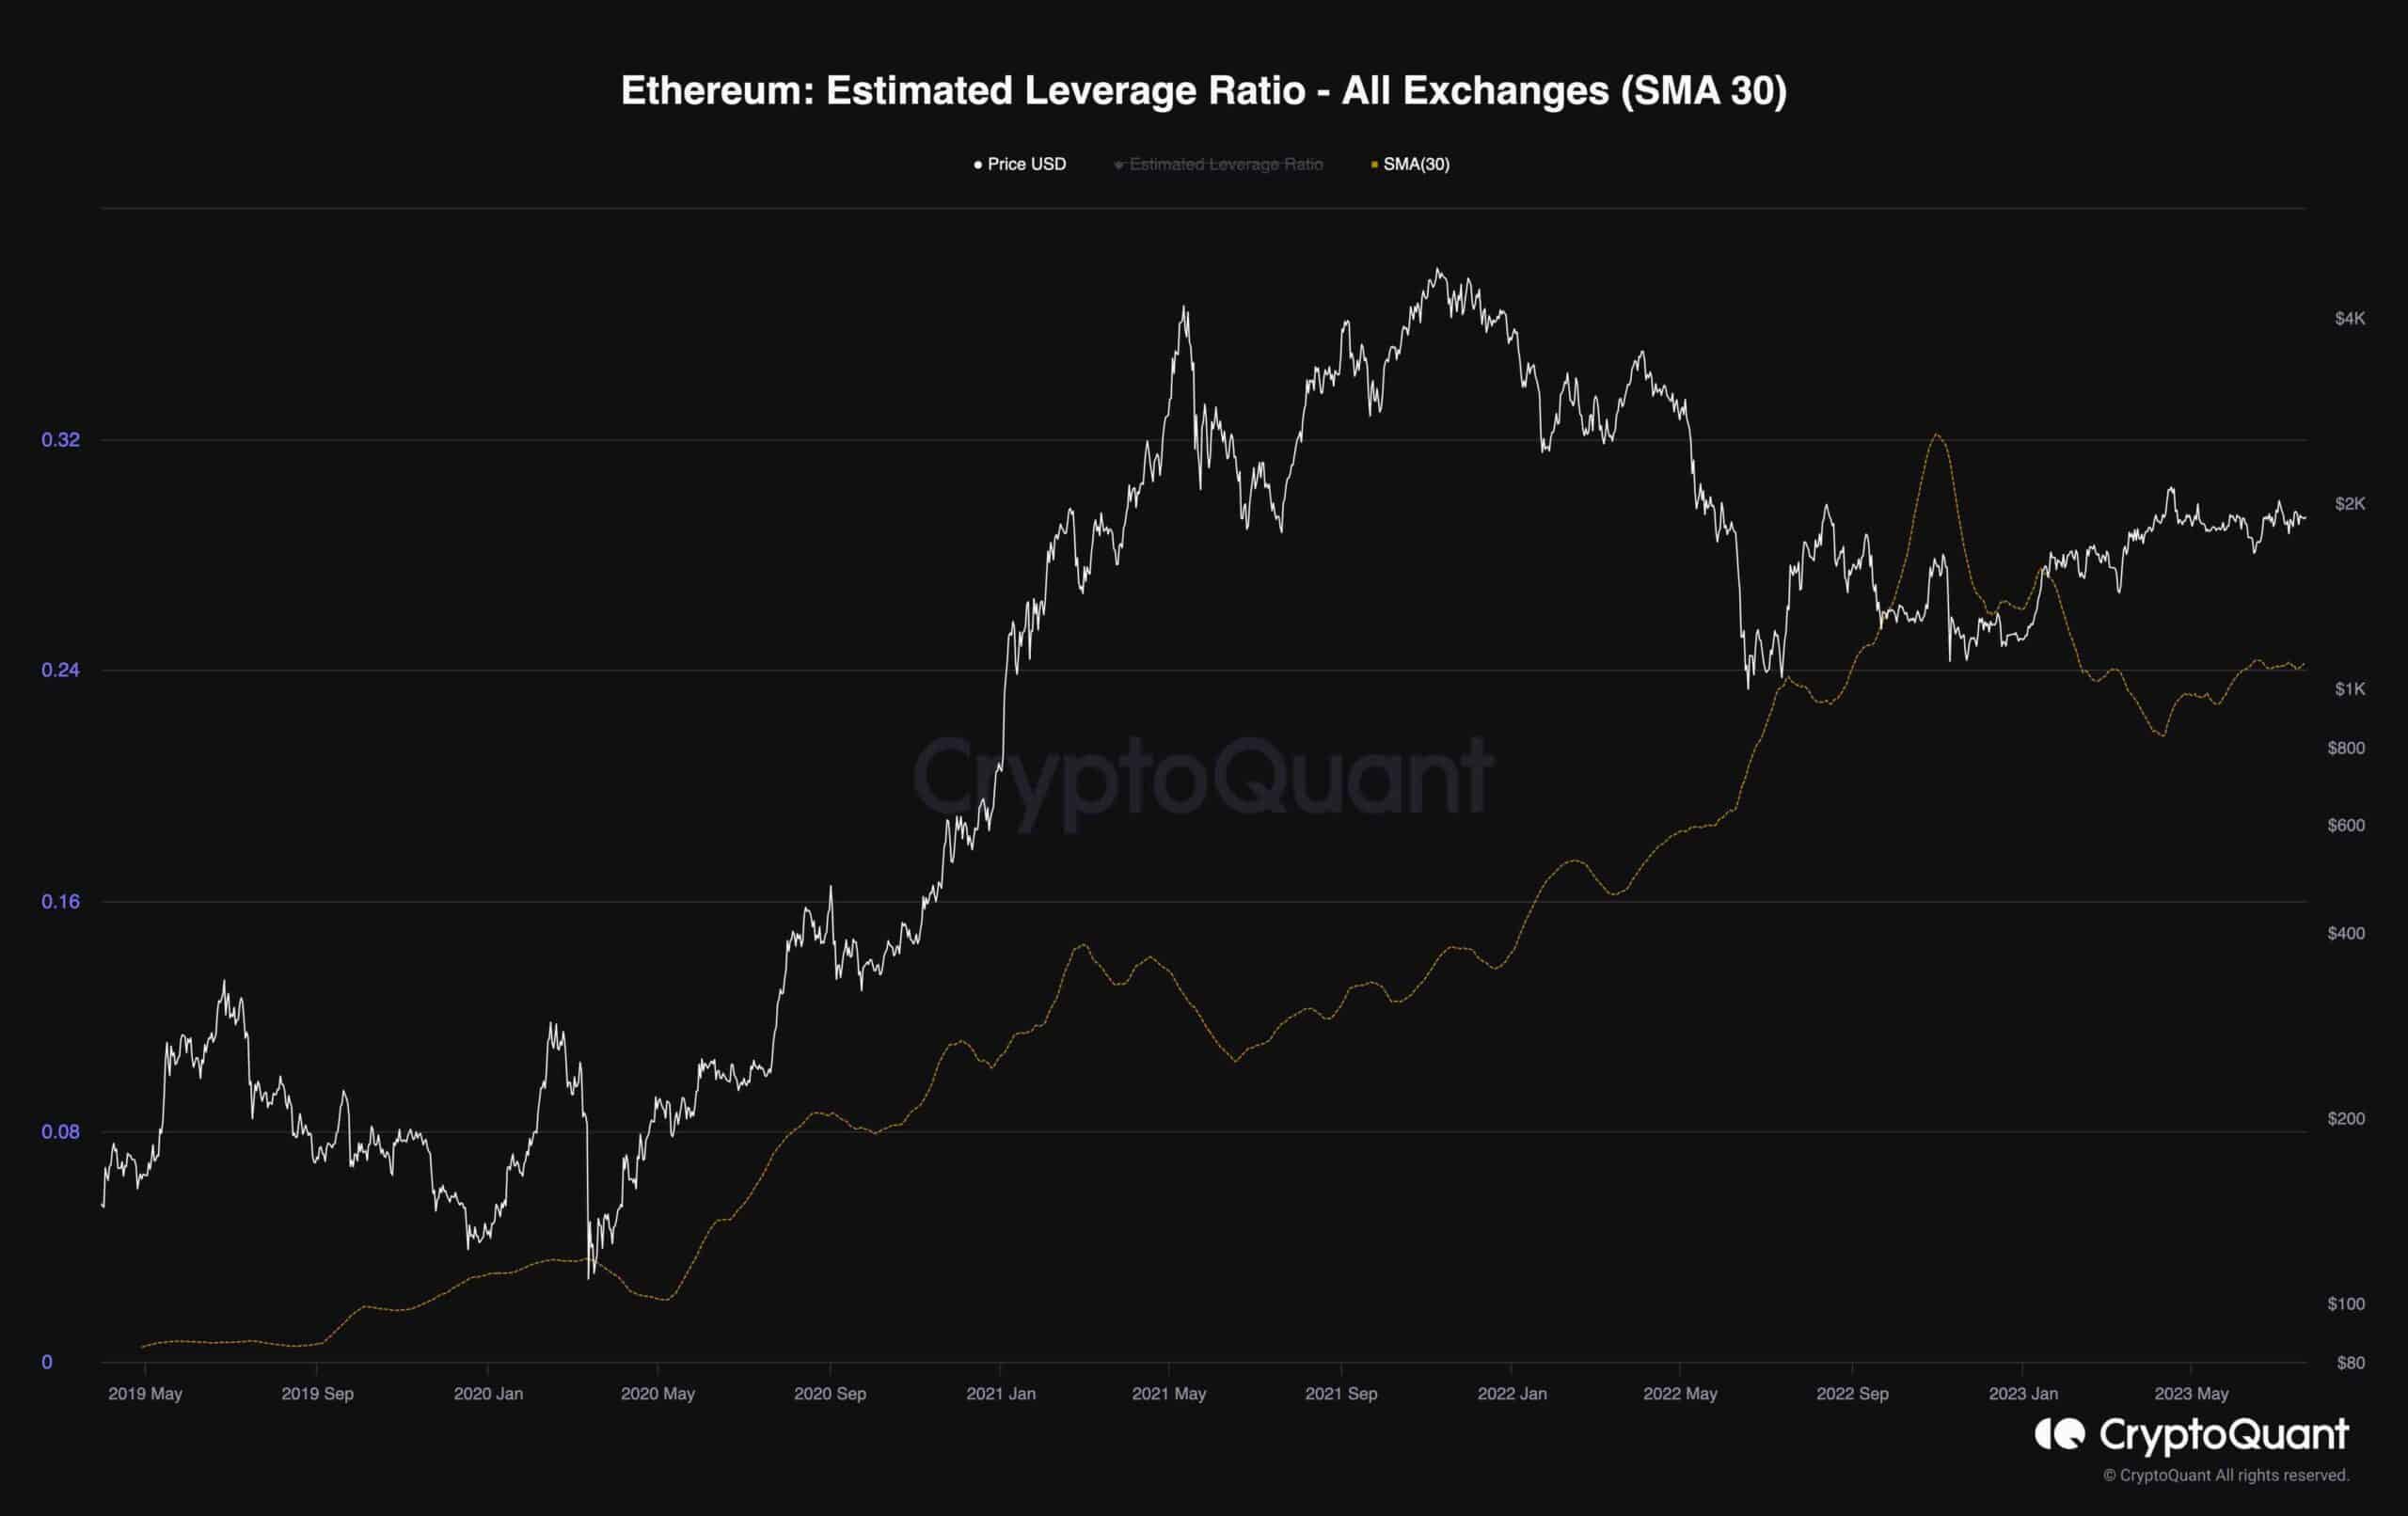
The provided chart displays the Estimated Leverage Ratio in correlation with ETH’s price. This metric gauges the average leverage employed by participants in the futures market. Generally, higher values indicate more investors are taking on greater leverage and risk in the derivatives market.
In recent weeks, the Estimated Leverage Ratio has seen a slight increase, suggesting that the futures market may be getting overheated due to the recent bullish price trends. However, it hasn’t reached concerning levels yet. Nonetheless, if the metric continues to surge, caution is advised as it could lead to a short or long-squeeze event.
In such a scenario, Ethereum’s price could experience a sudden and significant movement.