After breaking above both the 100-day moving average and the descending trendline, XRP has initiated a solid upward trend, reaching a significant resistance region at %excerpt%.55. The price action in this crucial zone will play a vital role in determining Ripple’s future direction. Technical Analysis By Shayan The Daily Chart Taking a closer look at the daily chart, once the price surpassed the 100-day moving average at %excerpt%.44, it went through a brief correction, testing the moving average through a pullback. This eventually led to an uptrend and a breakout above the descending trendline (highlighted in blue) at %excerpt%.46. Interestingly, the price continued its upward momentum and has now reached the critical resistance region of %excerpt%.55. However, the recent FUD (Fear, Uncertainty, and
Topics:
CryptoVizArt considers the following as important: Ripple (XRP) Price, XRP Analysis, xrpbtc, xrpusd
This could be interesting, too:
Jordan Lyanchev writes Ripple’s (XRP) Surge to Triggers Over Million in Short Liquidations
Jordan Lyanchev writes Trump Confirms Work on Strategic Crypto Reserve: XRP, ADA, SOL Included
Dimitar Dzhondzhorov writes Is a Major Ripple v. SEC Lawsuit Development Expected This Week? Here’s Why
Mandy Williams writes Ripple Releases Institutional DeFi Roadmap for XRP Ledger in 2025
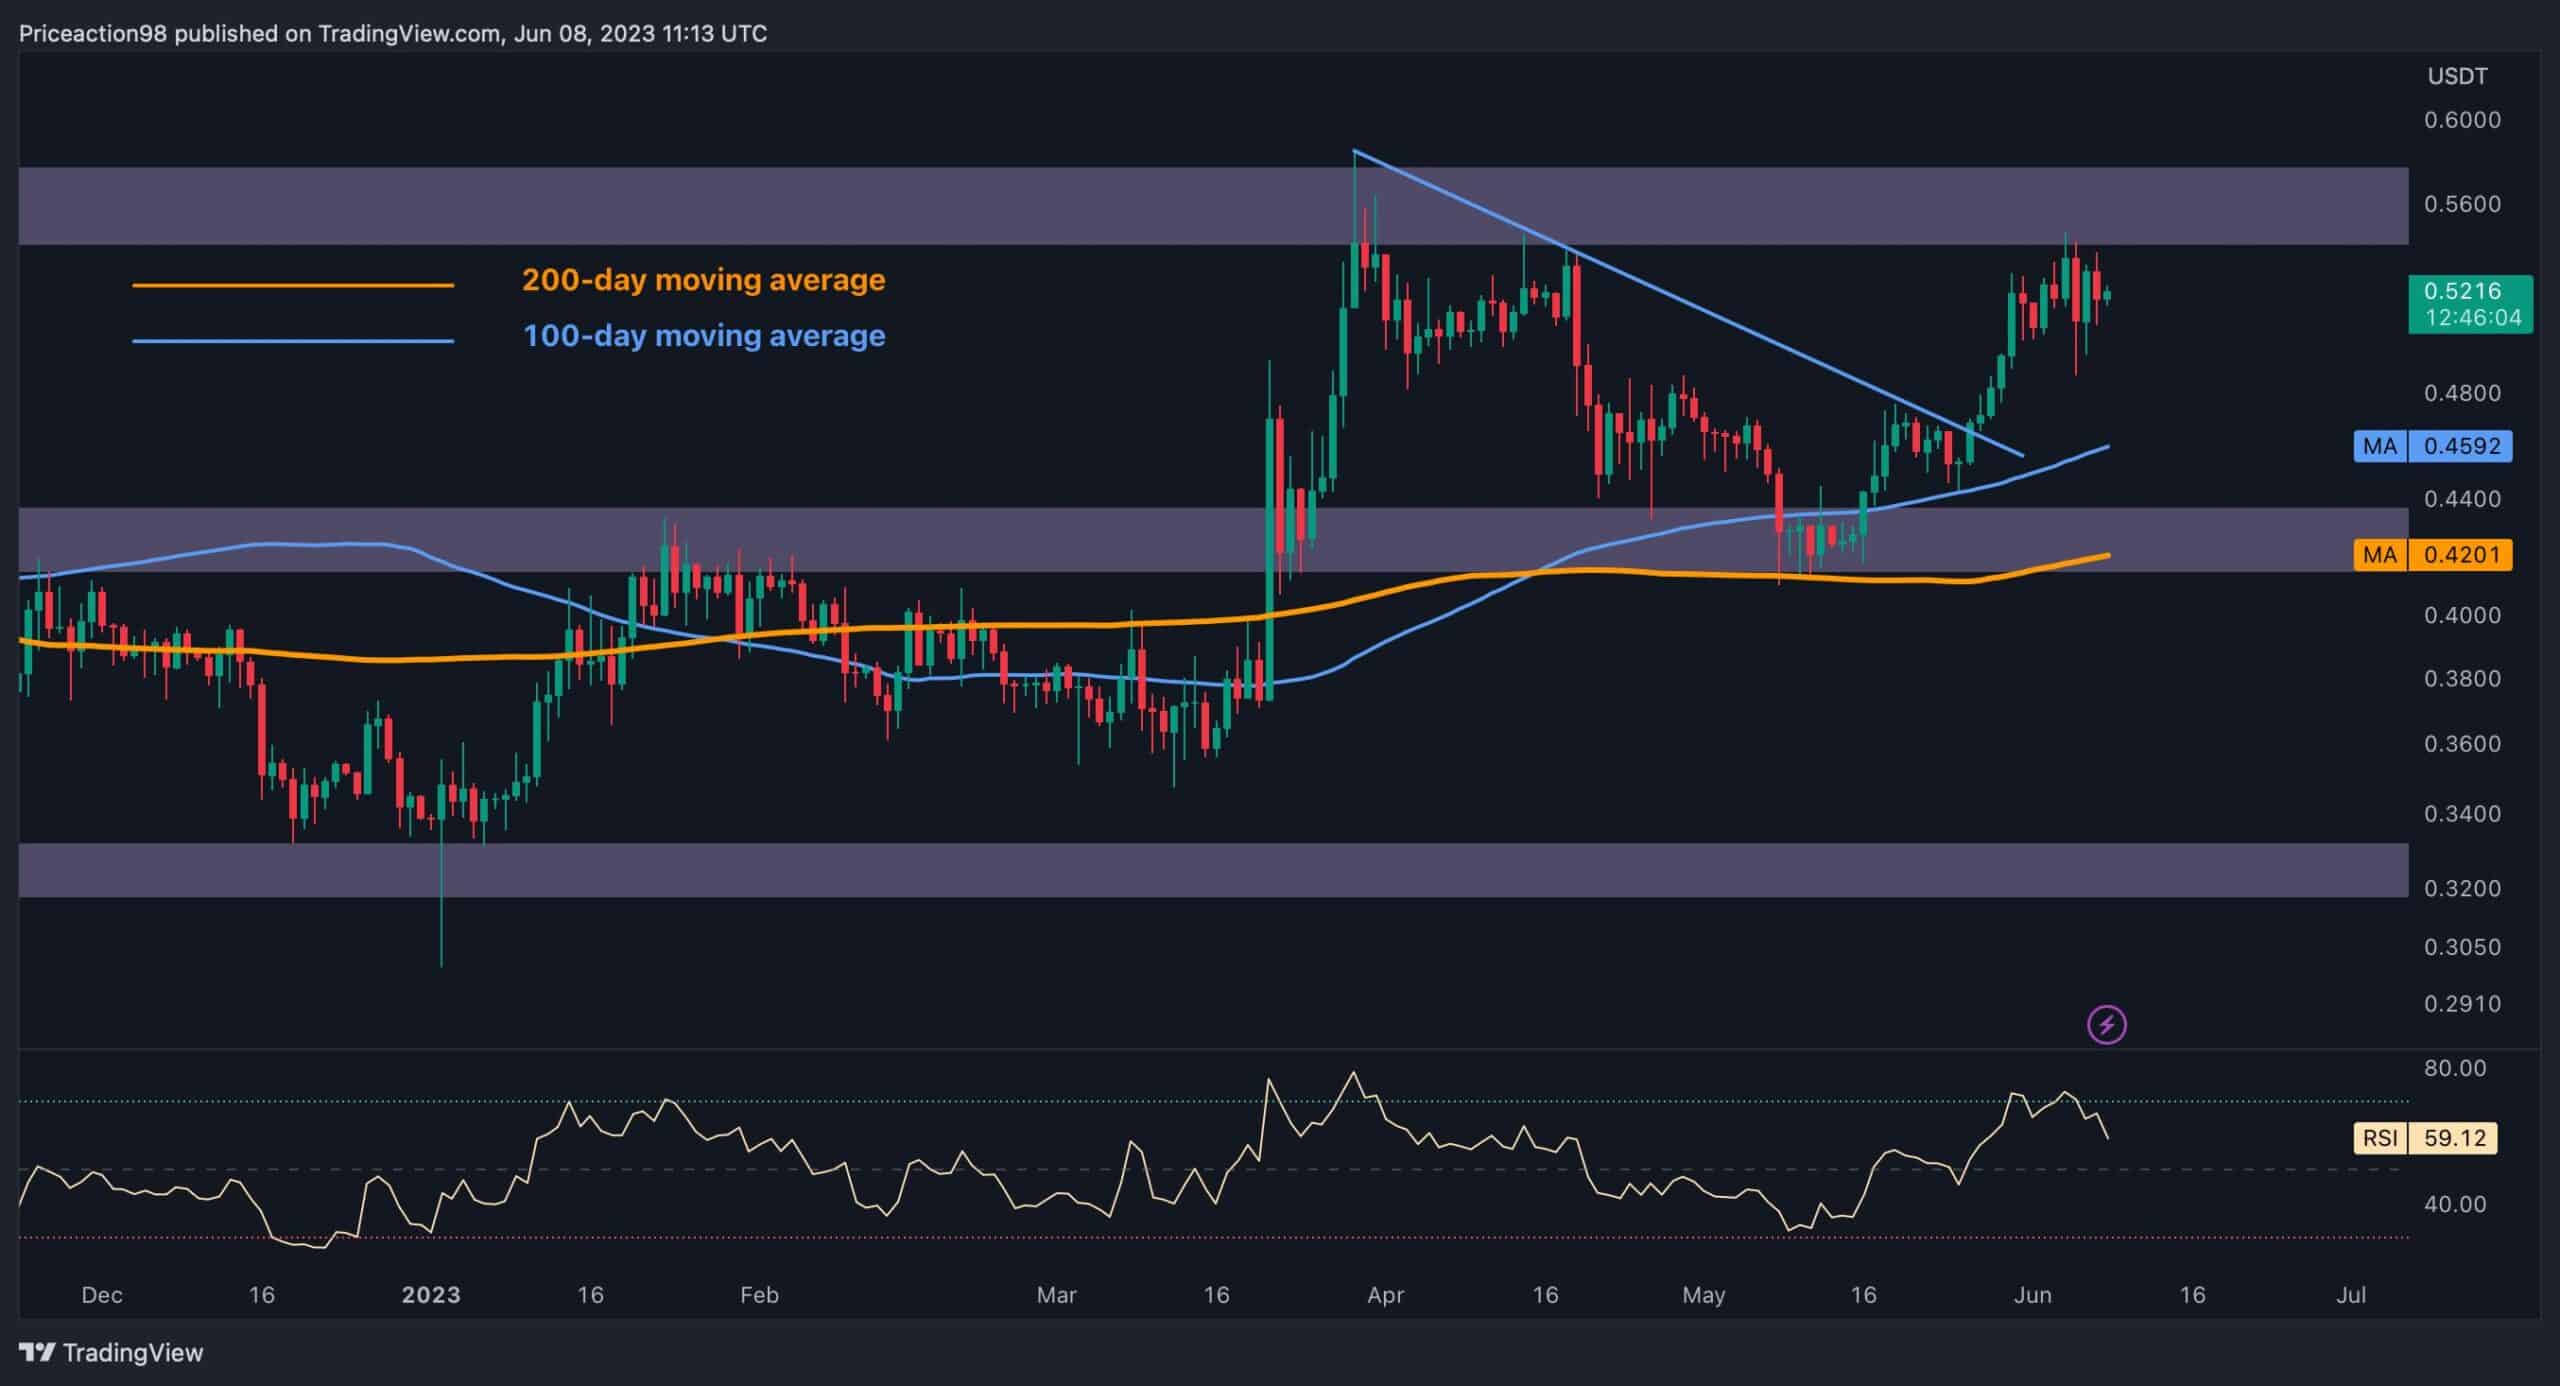
After breaking above both the 100-day moving average and the descending trendline, XRP has initiated a solid upward trend, reaching a significant resistance region at $0.55. The price action in this crucial zone will play a vital role in determining Ripple’s future direction.
Technical Analysis
By Shayan
The Daily Chart
Taking a closer look at the daily chart, once the price surpassed the 100-day moving average at $0.44, it went through a brief correction, testing the moving average through a pullback. This eventually led to an uptrend and a breakout above the descending trendline (highlighted in blue) at $0.46. Interestingly, the price continued its upward momentum and has now reached the critical resistance region of $0.55.
However, the recent FUD (Fear, Uncertainty, and Doubt) spreading into the market has weakened the bullish trend’s momentum, creating uncertainty. Nevertheless, Ripple’s recent price movements indicate a motivation to overcome the critical zone at $0.55. If successful, XRP will be more likely to embark on a long-term bullish rally, accompanied by occasional short-term correction phases.
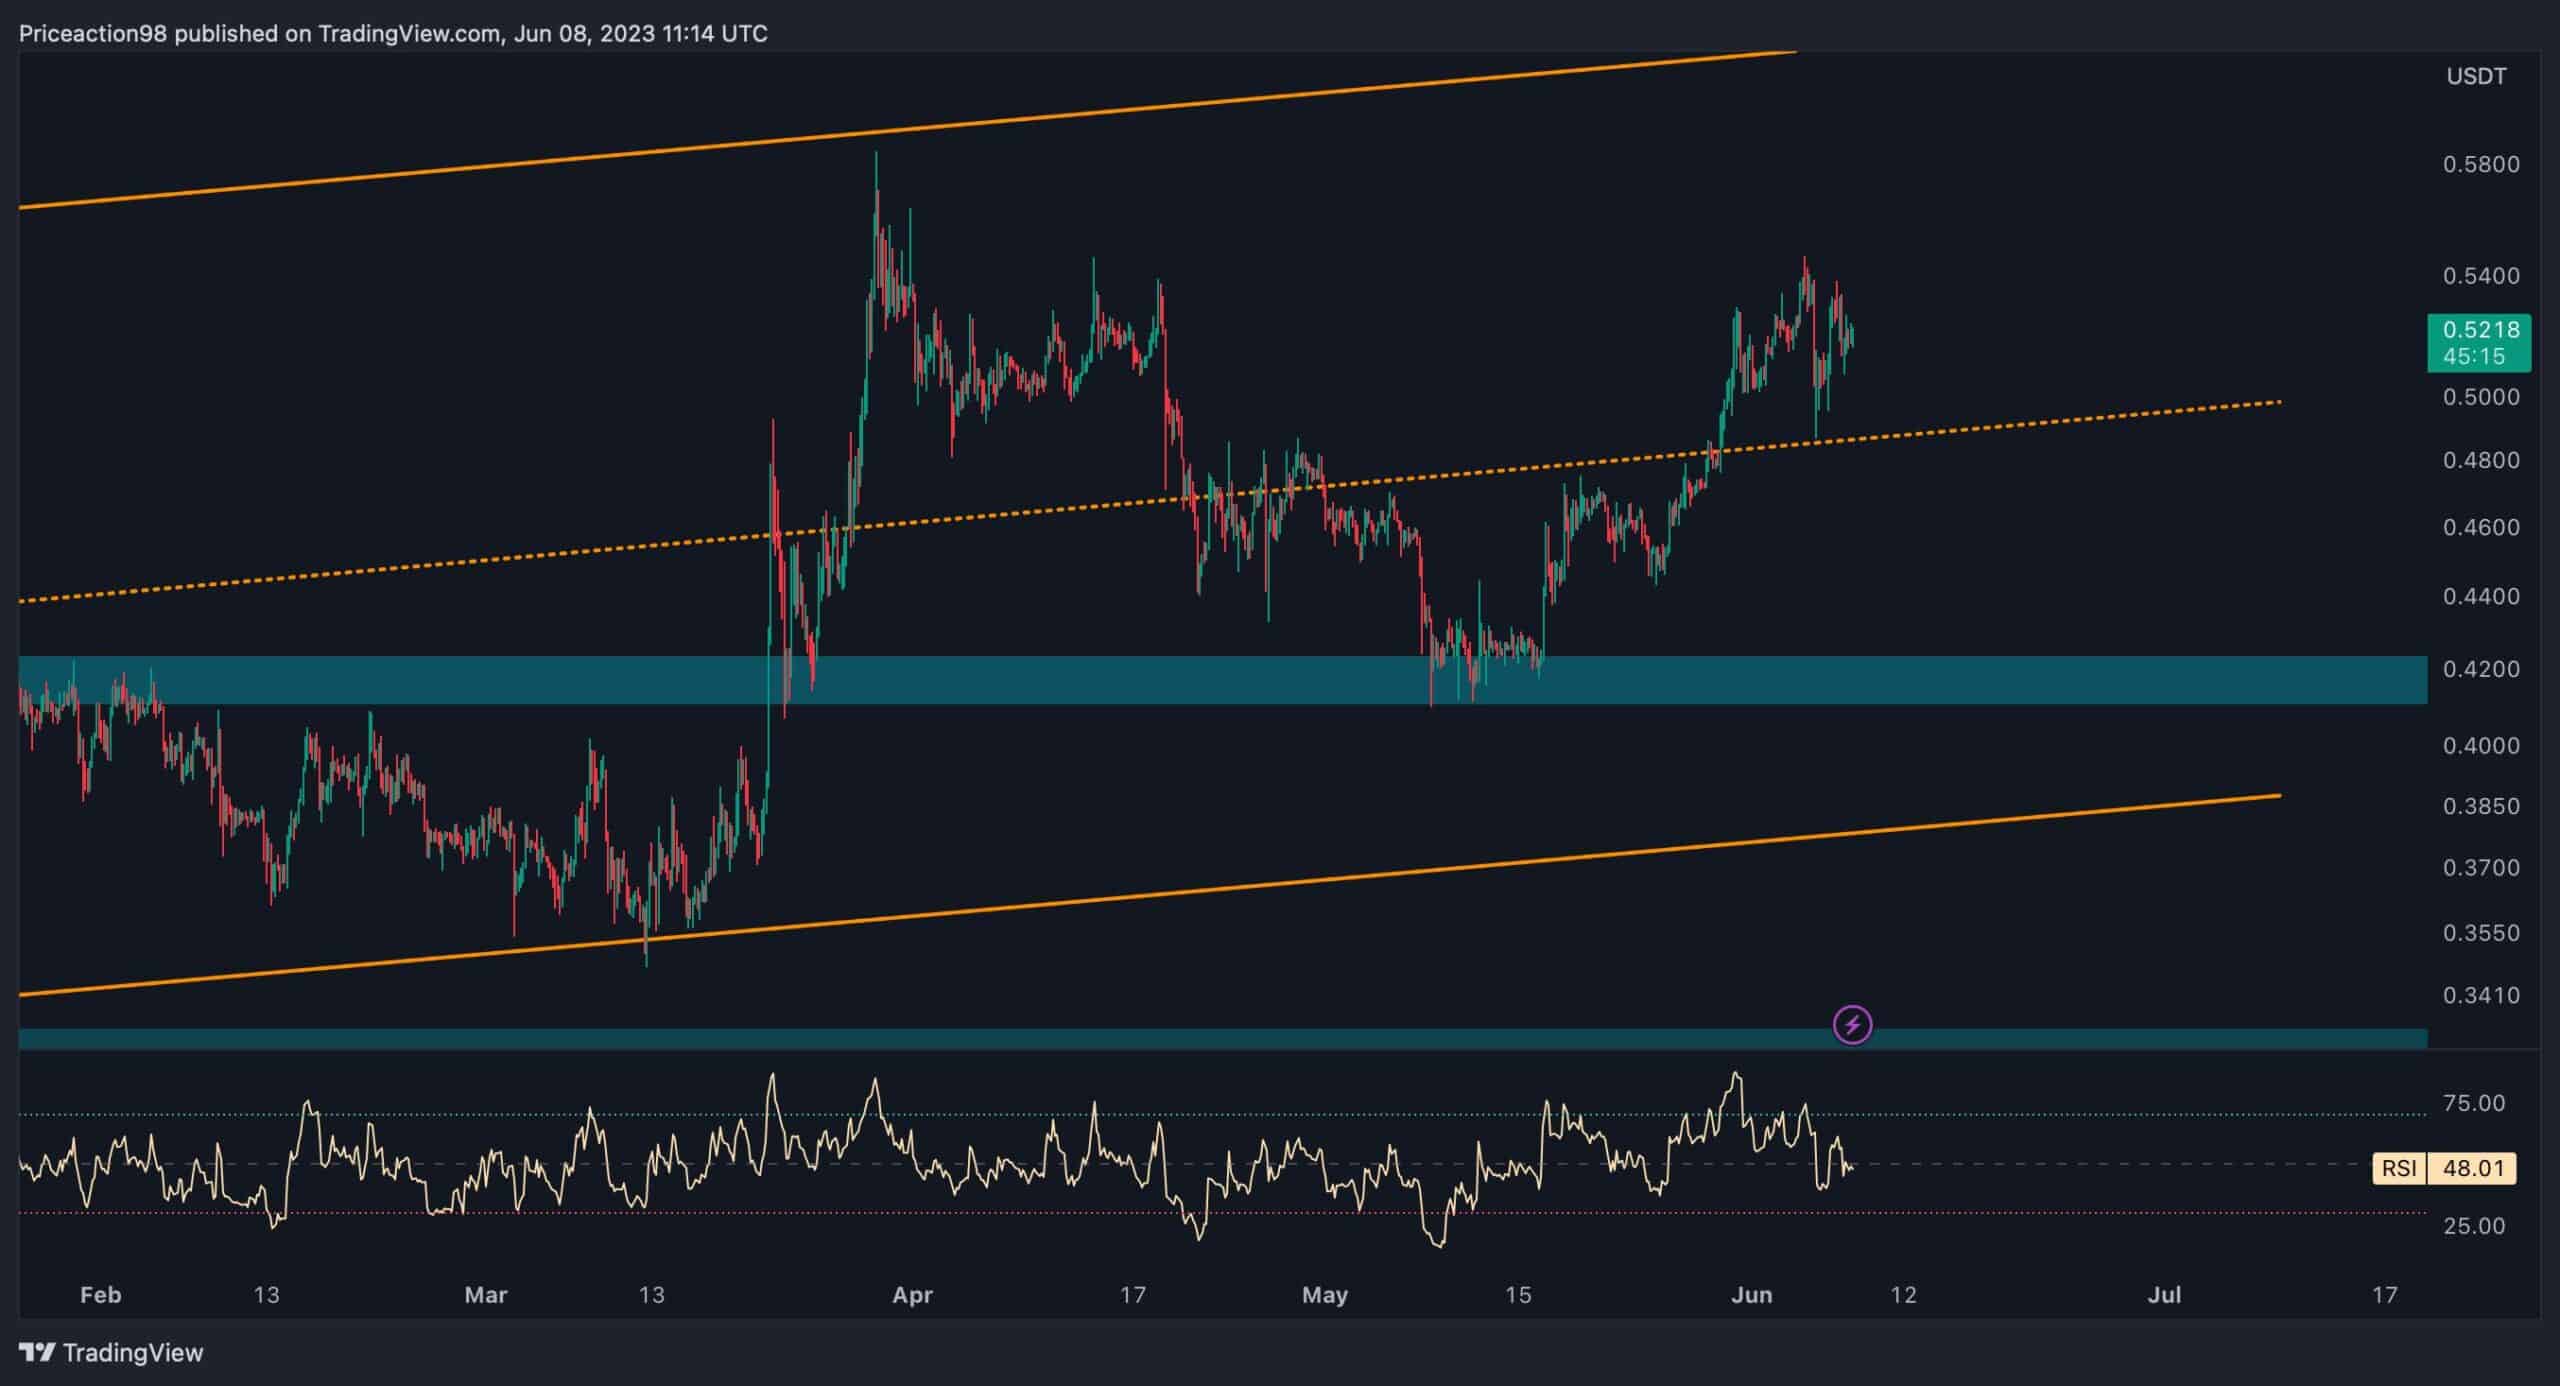
The 4-Hour Chart
Now shifting our focus to the 4-hour chart, after finding support around the significant region of $0.42, the price initiated a strong upward trend and surpassed the mid-trendline of the ascending channel.
However, after the uptrend continued for a while, the price entered a correction phase, retracing back to the broken trendline and confirming the breakout. Unfortunately, the market was filled with fear and uncertainty following the announcement of the conflict between the SEC and Binance, resulting in lackluster price action for Ripple.
Ultimately, it is probable that XRP is more likely to enter a consolidation stage before making its next significant move.