Ethereum’s price finds itself tightly confined within a narrow range, hemmed in by the upper boundary of the descending flag and the 100-day moving average. However, this narrow range is on the verge of being breached, indicating an imminent direction for its next move. Technical Analysis By Shayan The Daily Chart Zooming in on the daily chart, Ethereum has been struggling with the 100-day moving average for an extended period, failing to break below it. Presently, the price sits within a tight range between the 100-day moving average at 14 and the upper trendline of the descending flag, approximately at 80. However, the price is poised to break out of this critical range, which will determine the trajectory of its next movement. If it surges above the descending
Topics:
CryptoVizArt considers the following as important: ETH Analysis, ETHBTC, Ethereum (ETH) Price, ethusd
This could be interesting, too:
Mandy Williams writes Ethereum Derivatives Metrics Signal Modest Downside Tail Risk Ahead: Nansen
Jordan Lyanchev writes Weekly Bitcoin, Ethereum ETF Recap: Light at the End of the Tunnel for BTC
CryptoVizArt writes Will Weak Momentum Drive ETH to .5K? (Ethereum Price Analysis)
Jordan Lyanchev writes Bybit Hack Fallout: Arthur Hayes, Samson Mow Push for Ethereum Rollback
Ethereum’s price finds itself tightly confined within a narrow range, hemmed in by the upper boundary of the descending flag and the 100-day moving average. However, this narrow range is on the verge of being breached, indicating an imminent direction for its next move.
Technical Analysis
By Shayan
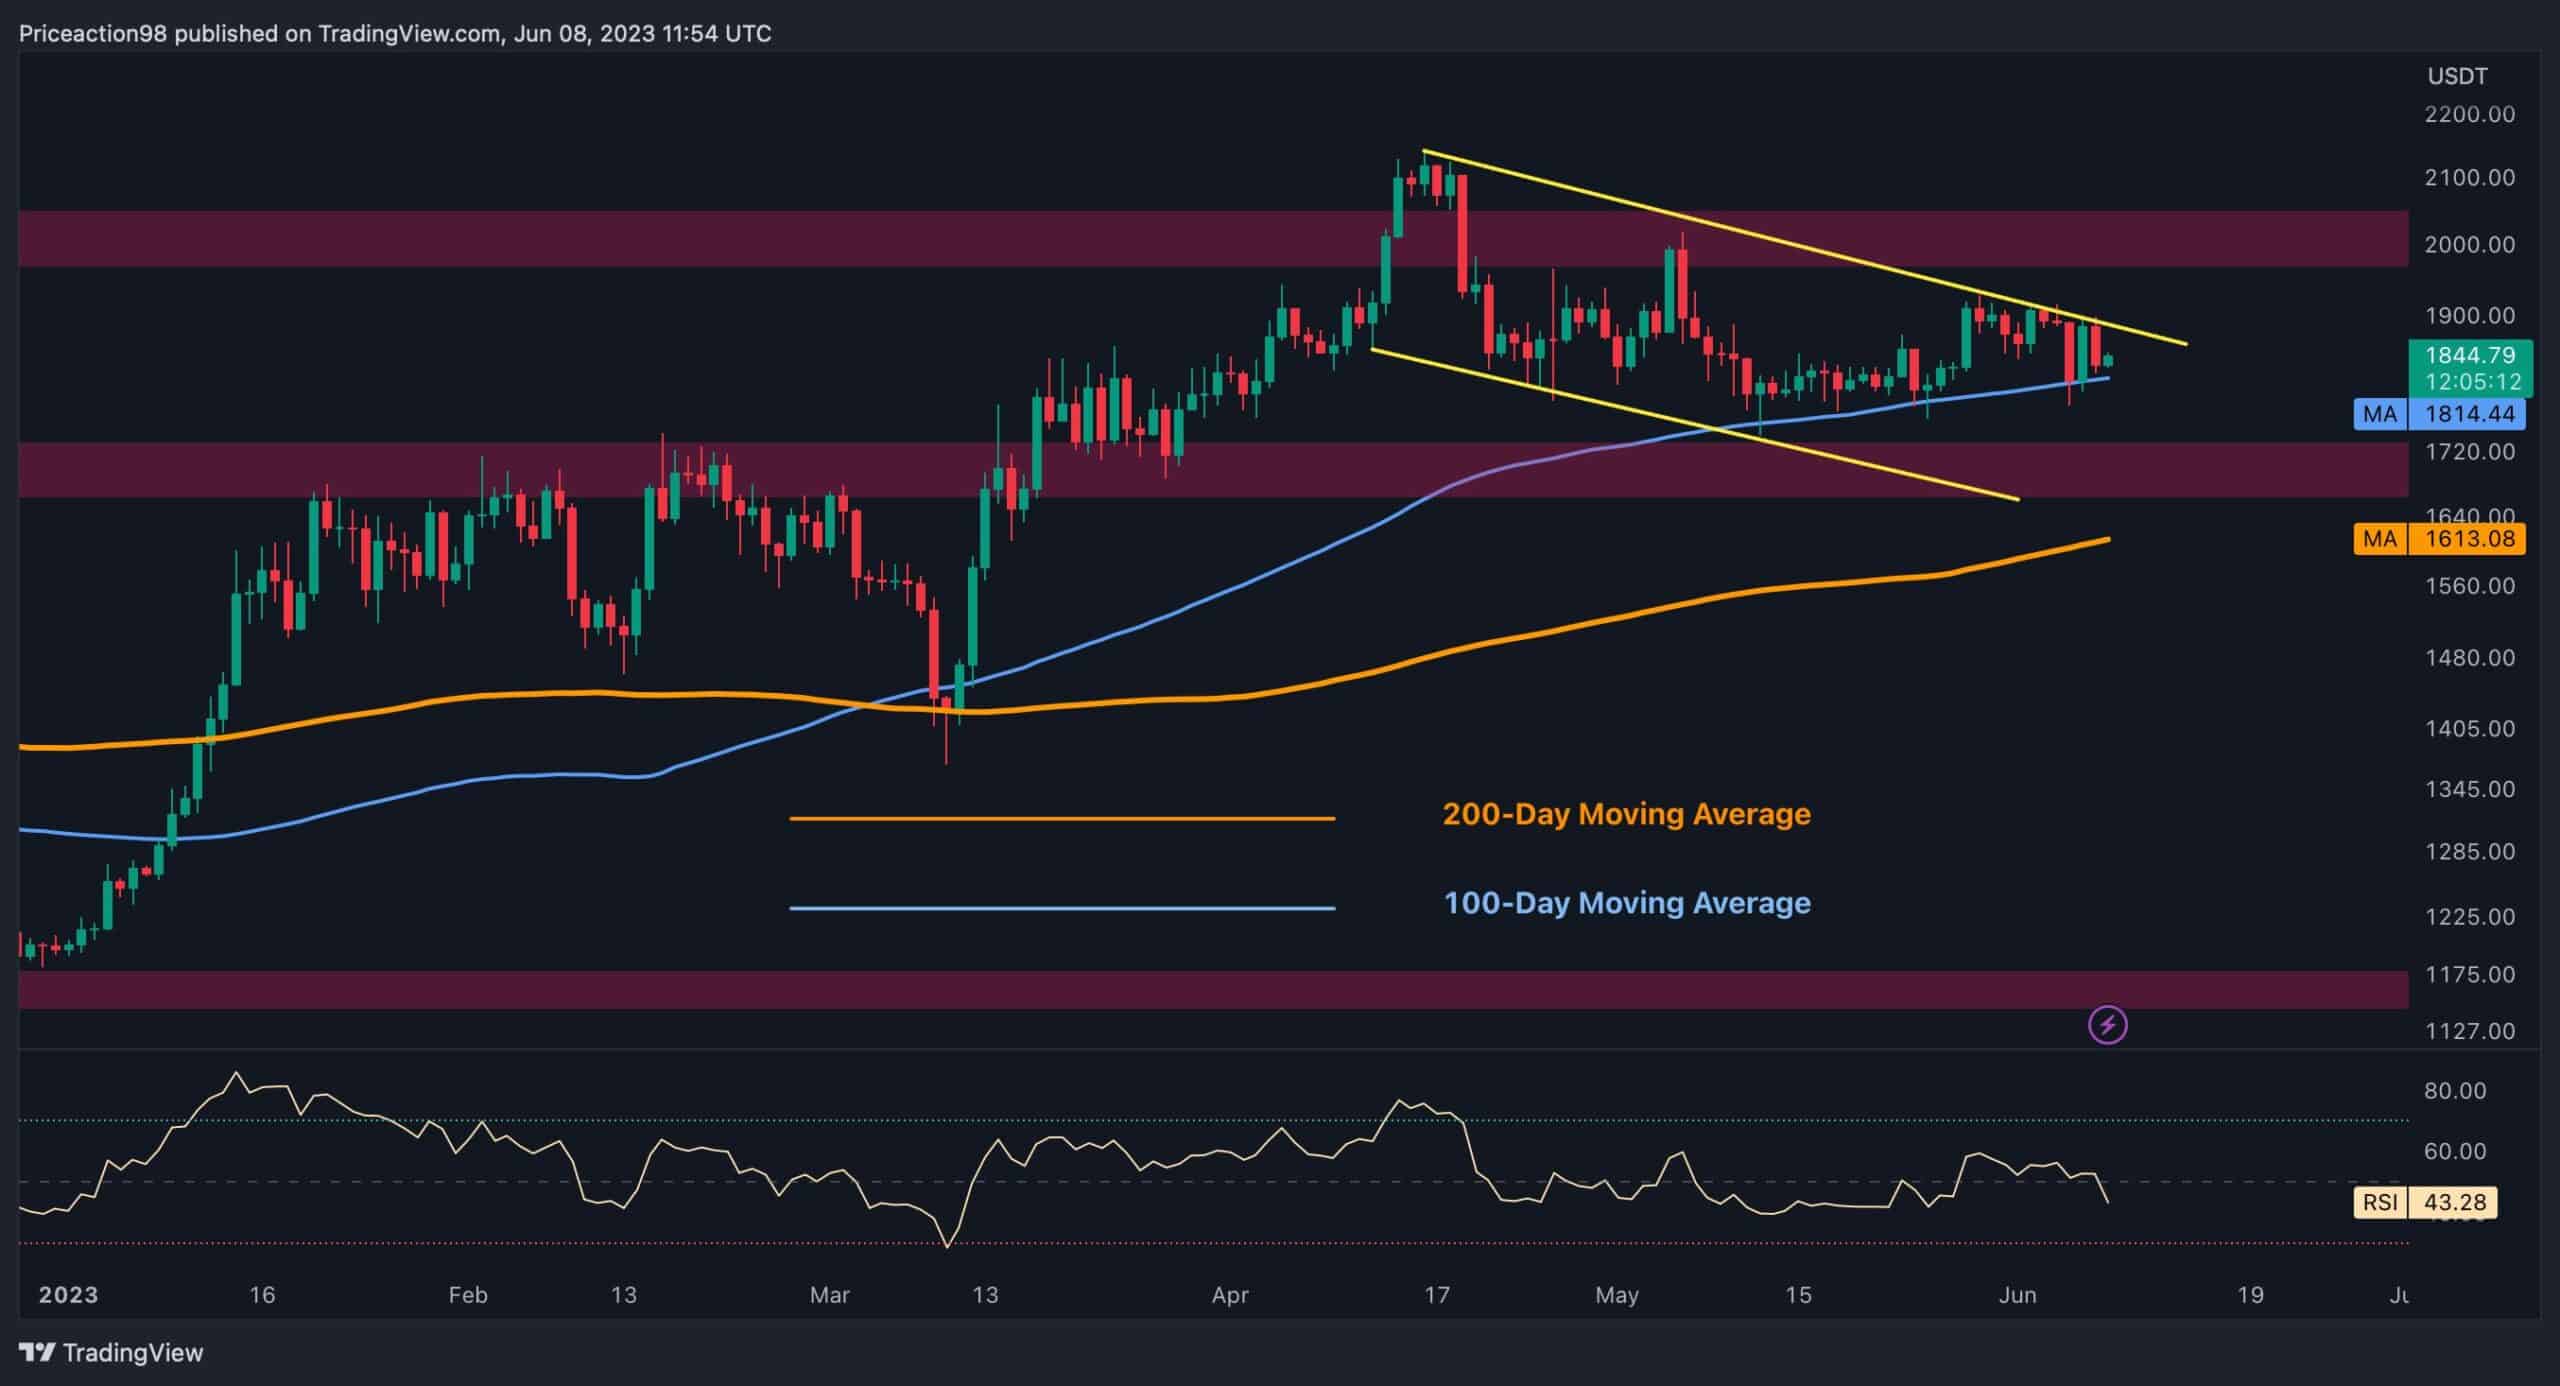
The Daily Chart
Zooming in on the daily chart, Ethereum has been struggling with the 100-day moving average for an extended period, failing to break below it. Presently, the price sits within a tight range between the 100-day moving average at $1814 and the upper trendline of the descending flag, approximately at $1880.
However, the price is poised to break out of this critical range, which will determine the trajectory of its next movement. If it surges above the descending trendline, Ethereum’s price will aim for the significant resistance zone around $2K. Conversely, a drop below the 100-day MA will lead to a cascade toward the next support level at roughly $1.7K.
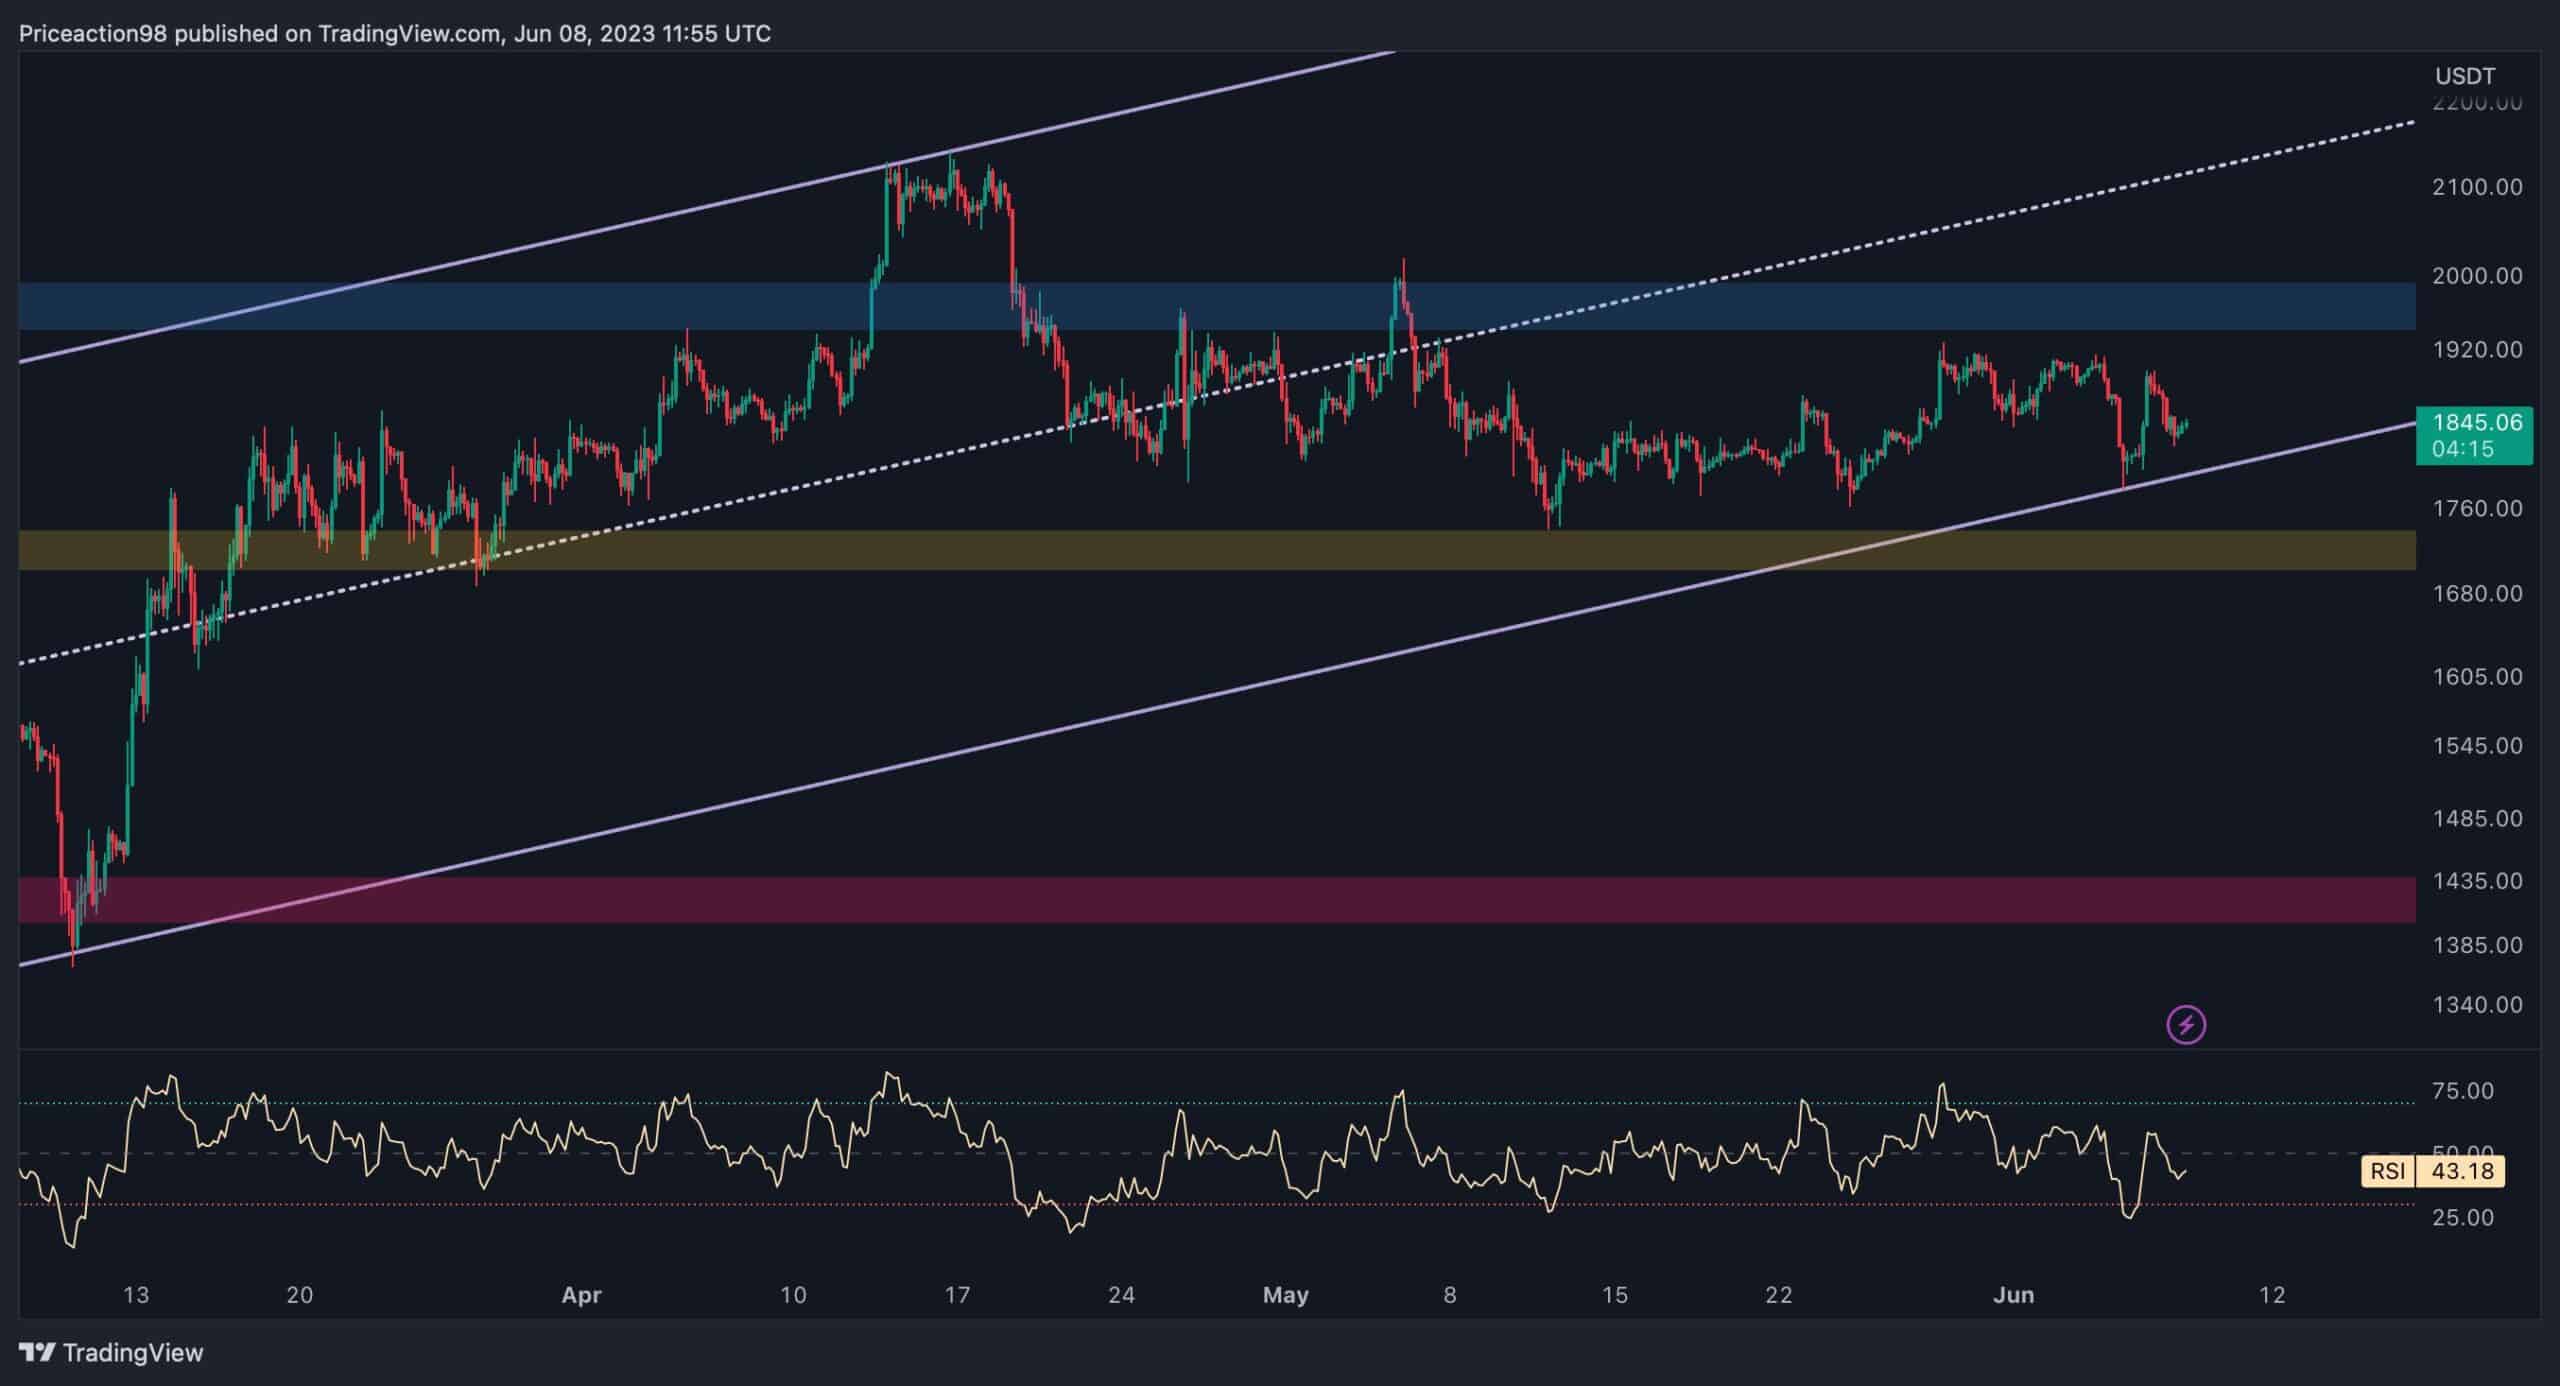
The 4-Hour Chart
Shifting the focus to the 4-hour chart, it becomes evident that Ethereum has been trapped within a consolidation range, bounded by the static resistance zone at $2K and the static support region at $1.7K. This range has persisted for several months following unsuccessful attempts to break out.
However, Ethereum’s price also encounters a dynamic support level at the lower boundary of the ascending channel, presently at $1.8K. The cryptocurrency seems likely to remain confined within this consolidation range until the market attains a state of calmness and the SEC-Binance issue is resolved.
During this period, exercising extra caution is essential if participating in futures trading.