Ripple’s price has surged in recent weeks, following a breakout above the significant %excerpt%.43 resistance level. However, it may be too early for the bulls to celebrate the end of the bear market, as warning signals are emerging. Technical Analysis By: Edris XRP/USDT Daily Chart: The price has risen almost vertically in the past few weeks, following a breakout above the %excerpt%.43 level and both the 50-day and 200-day moving averages, which are located around the %excerpt%.4 mark. These moving averages are also on the verge of a bullish crossover, as the 50-day moving average is almost crossing the 200-day one to the upside. However, from a classical price action standpoint, things do not look so great. The price has been decisively rejected from the key %excerpt%.55 resistance level, and the
Topics:
CryptoVizArt considers the following as important: Ripple (XRP) Price, XRP Analysis, xrpbtc, xrpusd
This could be interesting, too:
Jordan Lyanchev writes Ripple’s (XRP) Surge to Triggers Over Million in Short Liquidations
Jordan Lyanchev writes Trump Confirms Work on Strategic Crypto Reserve: XRP, ADA, SOL Included
Dimitar Dzhondzhorov writes Is a Major Ripple v. SEC Lawsuit Development Expected This Week? Here’s Why
Mandy Williams writes Ripple Releases Institutional DeFi Roadmap for XRP Ledger in 2025
Ripple’s price has surged in recent weeks, following a breakout above the significant $0.43 resistance level. However, it may be too early for the bulls to celebrate the end of the bear market, as warning signals are emerging.
Technical Analysis
By: Edris
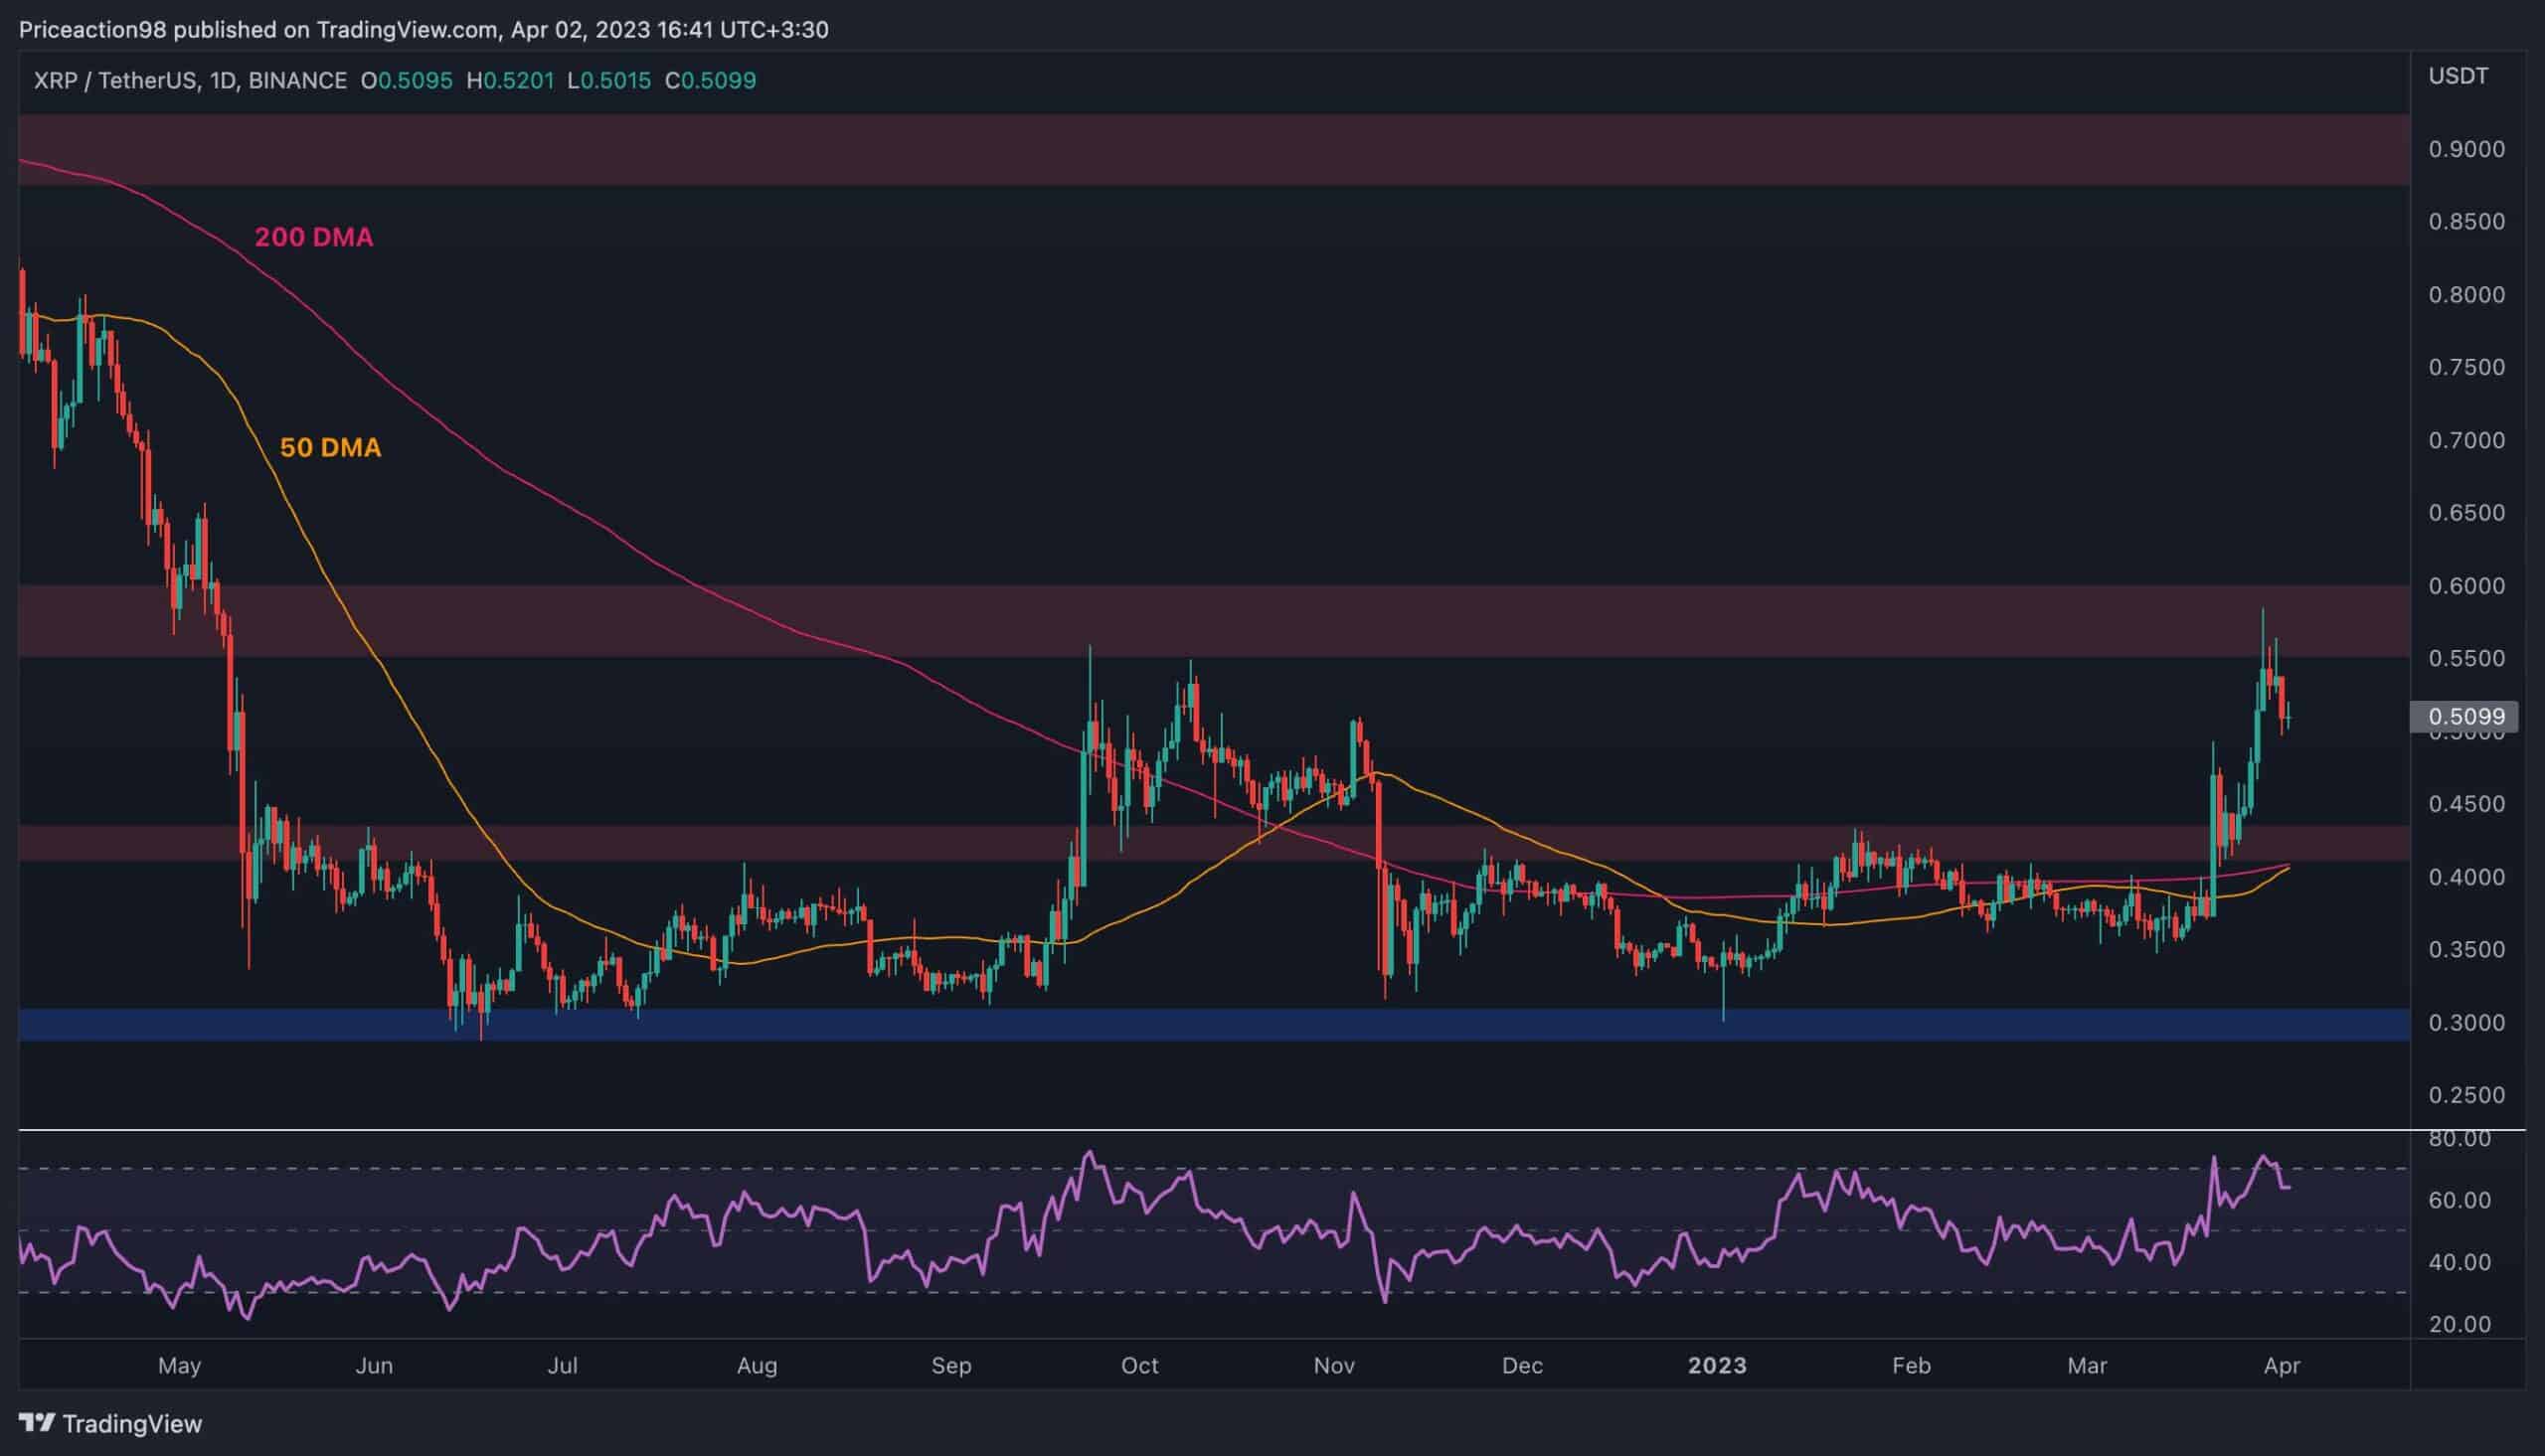
XRP/USDT Daily Chart:
The price has risen almost vertically in the past few weeks, following a breakout above the $0.43 level and both the 50-day and 200-day moving averages, which are located around the $0.4 mark.
These moving averages are also on the verge of a bullish crossover, as the 50-day moving average is almost crossing the 200-day one to the upside. However, from a classical price action standpoint, things do not look so great.
The price has been decisively rejected from the key $0.55 resistance level, and the RSI is showing a clear bearish divergence between the last two price highs, indicating that a correction might occur soon. In this case, the $0.43 support level would be the first potential support area.
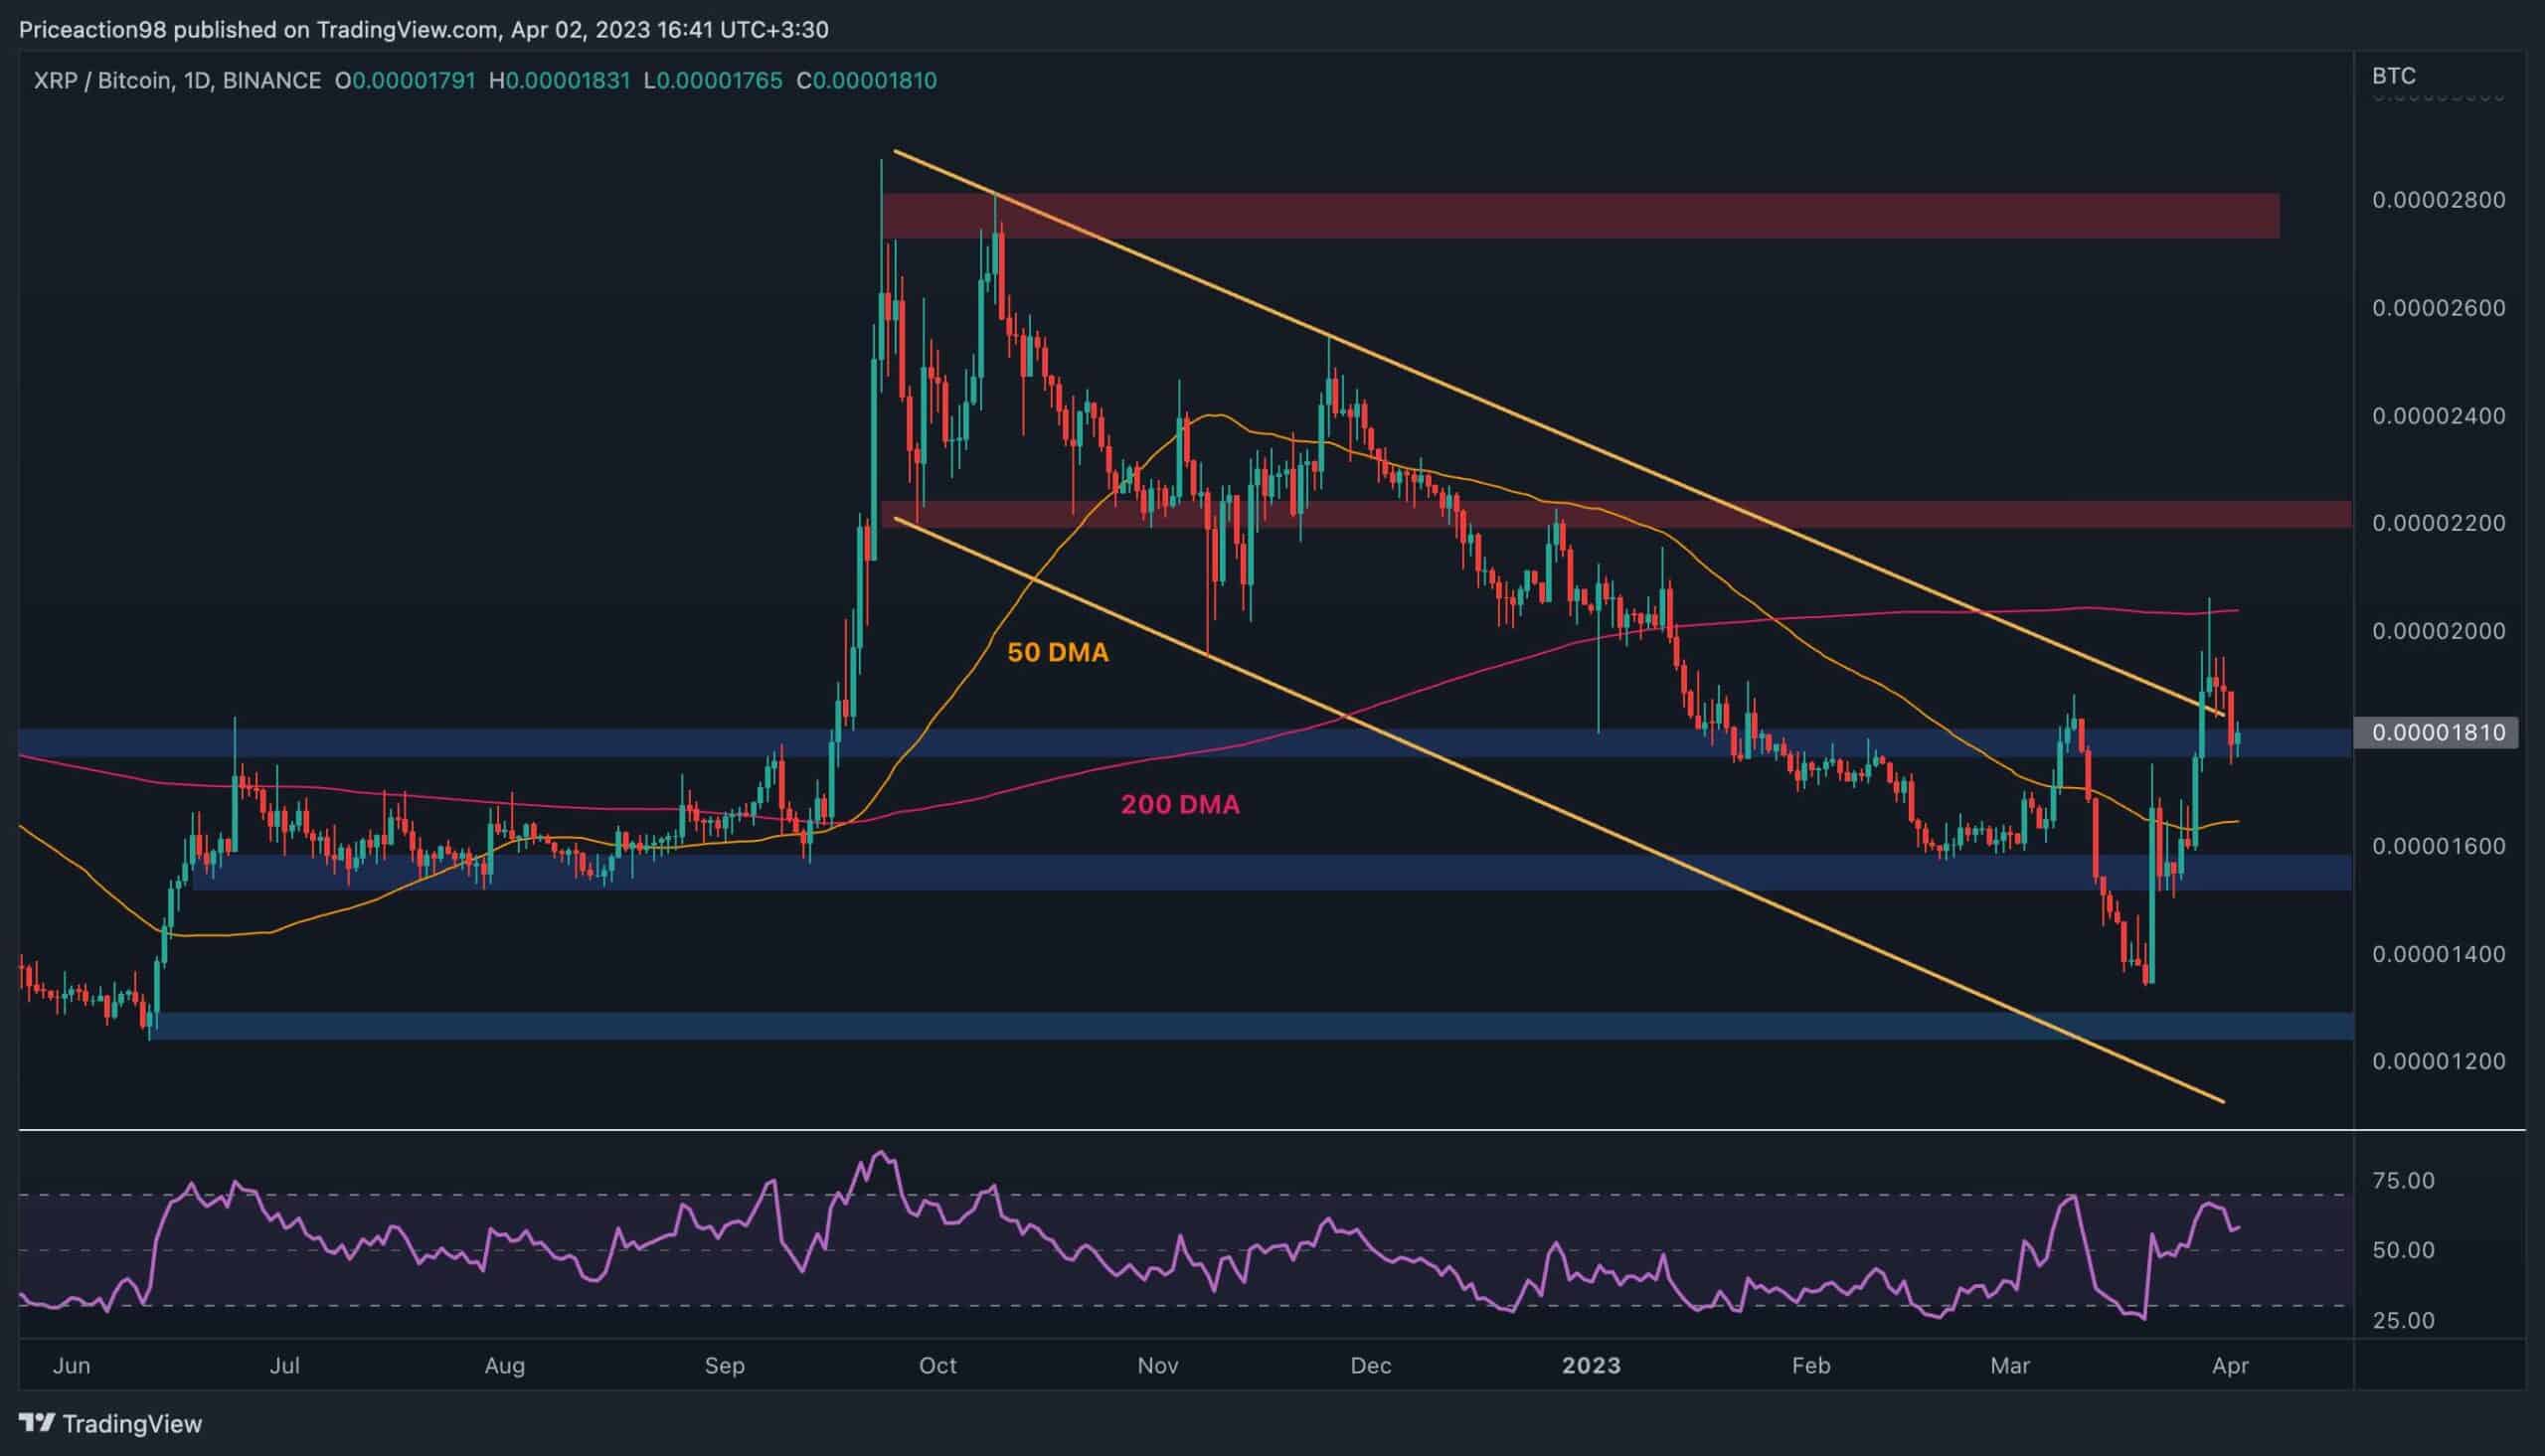
XRP/BTC Daily Chart:
Against BTC, things look even worse, as the price is seemingly dropping back inside the broken descending channel after being impulsively rejected from the 200-day moving average around the 0.00002 SAT. If the 0.000018 SAT level fails to hold, the recent breakout would be considered fake and could lead to the price declining deeper inside the channel toward the 0.000016 SAT in the short term.
On the other hand, if the market rebounds from the current area, the 200-day moving average would be the first target, followed by the 0.000022 SAT static resistance level. However, judging from the current price action, a pullback seems more likely in the short term.