ETH’s price has been on the rise since rebounding from the 00 area and has broken through multiple significant resistance levels. However, the cryptocurrency is currently demonstrating a lack of momentum, hinting at a potential correction in the short term. Technical Analysis By: Edris The Daily Chart: On the daily chart, the price has been holding above the broken symmetrical triangle after breaking it to the upside. However, the 00 resistance area is yet to be captured, and the price has struggled to advance. Currently, the market is moving higher slowly after retesting the higher boundary of the symmetrical triangle but is not showing decisive momentum to move away from the 00 level. If a correction happens in the coming days, the higher trendline of the
Topics:
CryptoVizArt considers the following as important: ETH Analysis, ETHBTC, Ethereum (ETH) Price, ethusd
This could be interesting, too:
Mandy Williams writes Ethereum Derivatives Metrics Signal Modest Downside Tail Risk Ahead: Nansen
Jordan Lyanchev writes Weekly Bitcoin, Ethereum ETF Recap: Light at the End of the Tunnel for BTC
CryptoVizArt writes Will Weak Momentum Drive ETH to .5K? (Ethereum Price Analysis)
Jordan Lyanchev writes Bybit Hack Fallout: Arthur Hayes, Samson Mow Push for Ethereum Rollback
ETH’s price has been on the rise since rebounding from the $1000 area and has broken through multiple significant resistance levels. However, the cryptocurrency is currently demonstrating a lack of momentum, hinting at a potential correction in the short term.
Technical Analysis
By: Edris
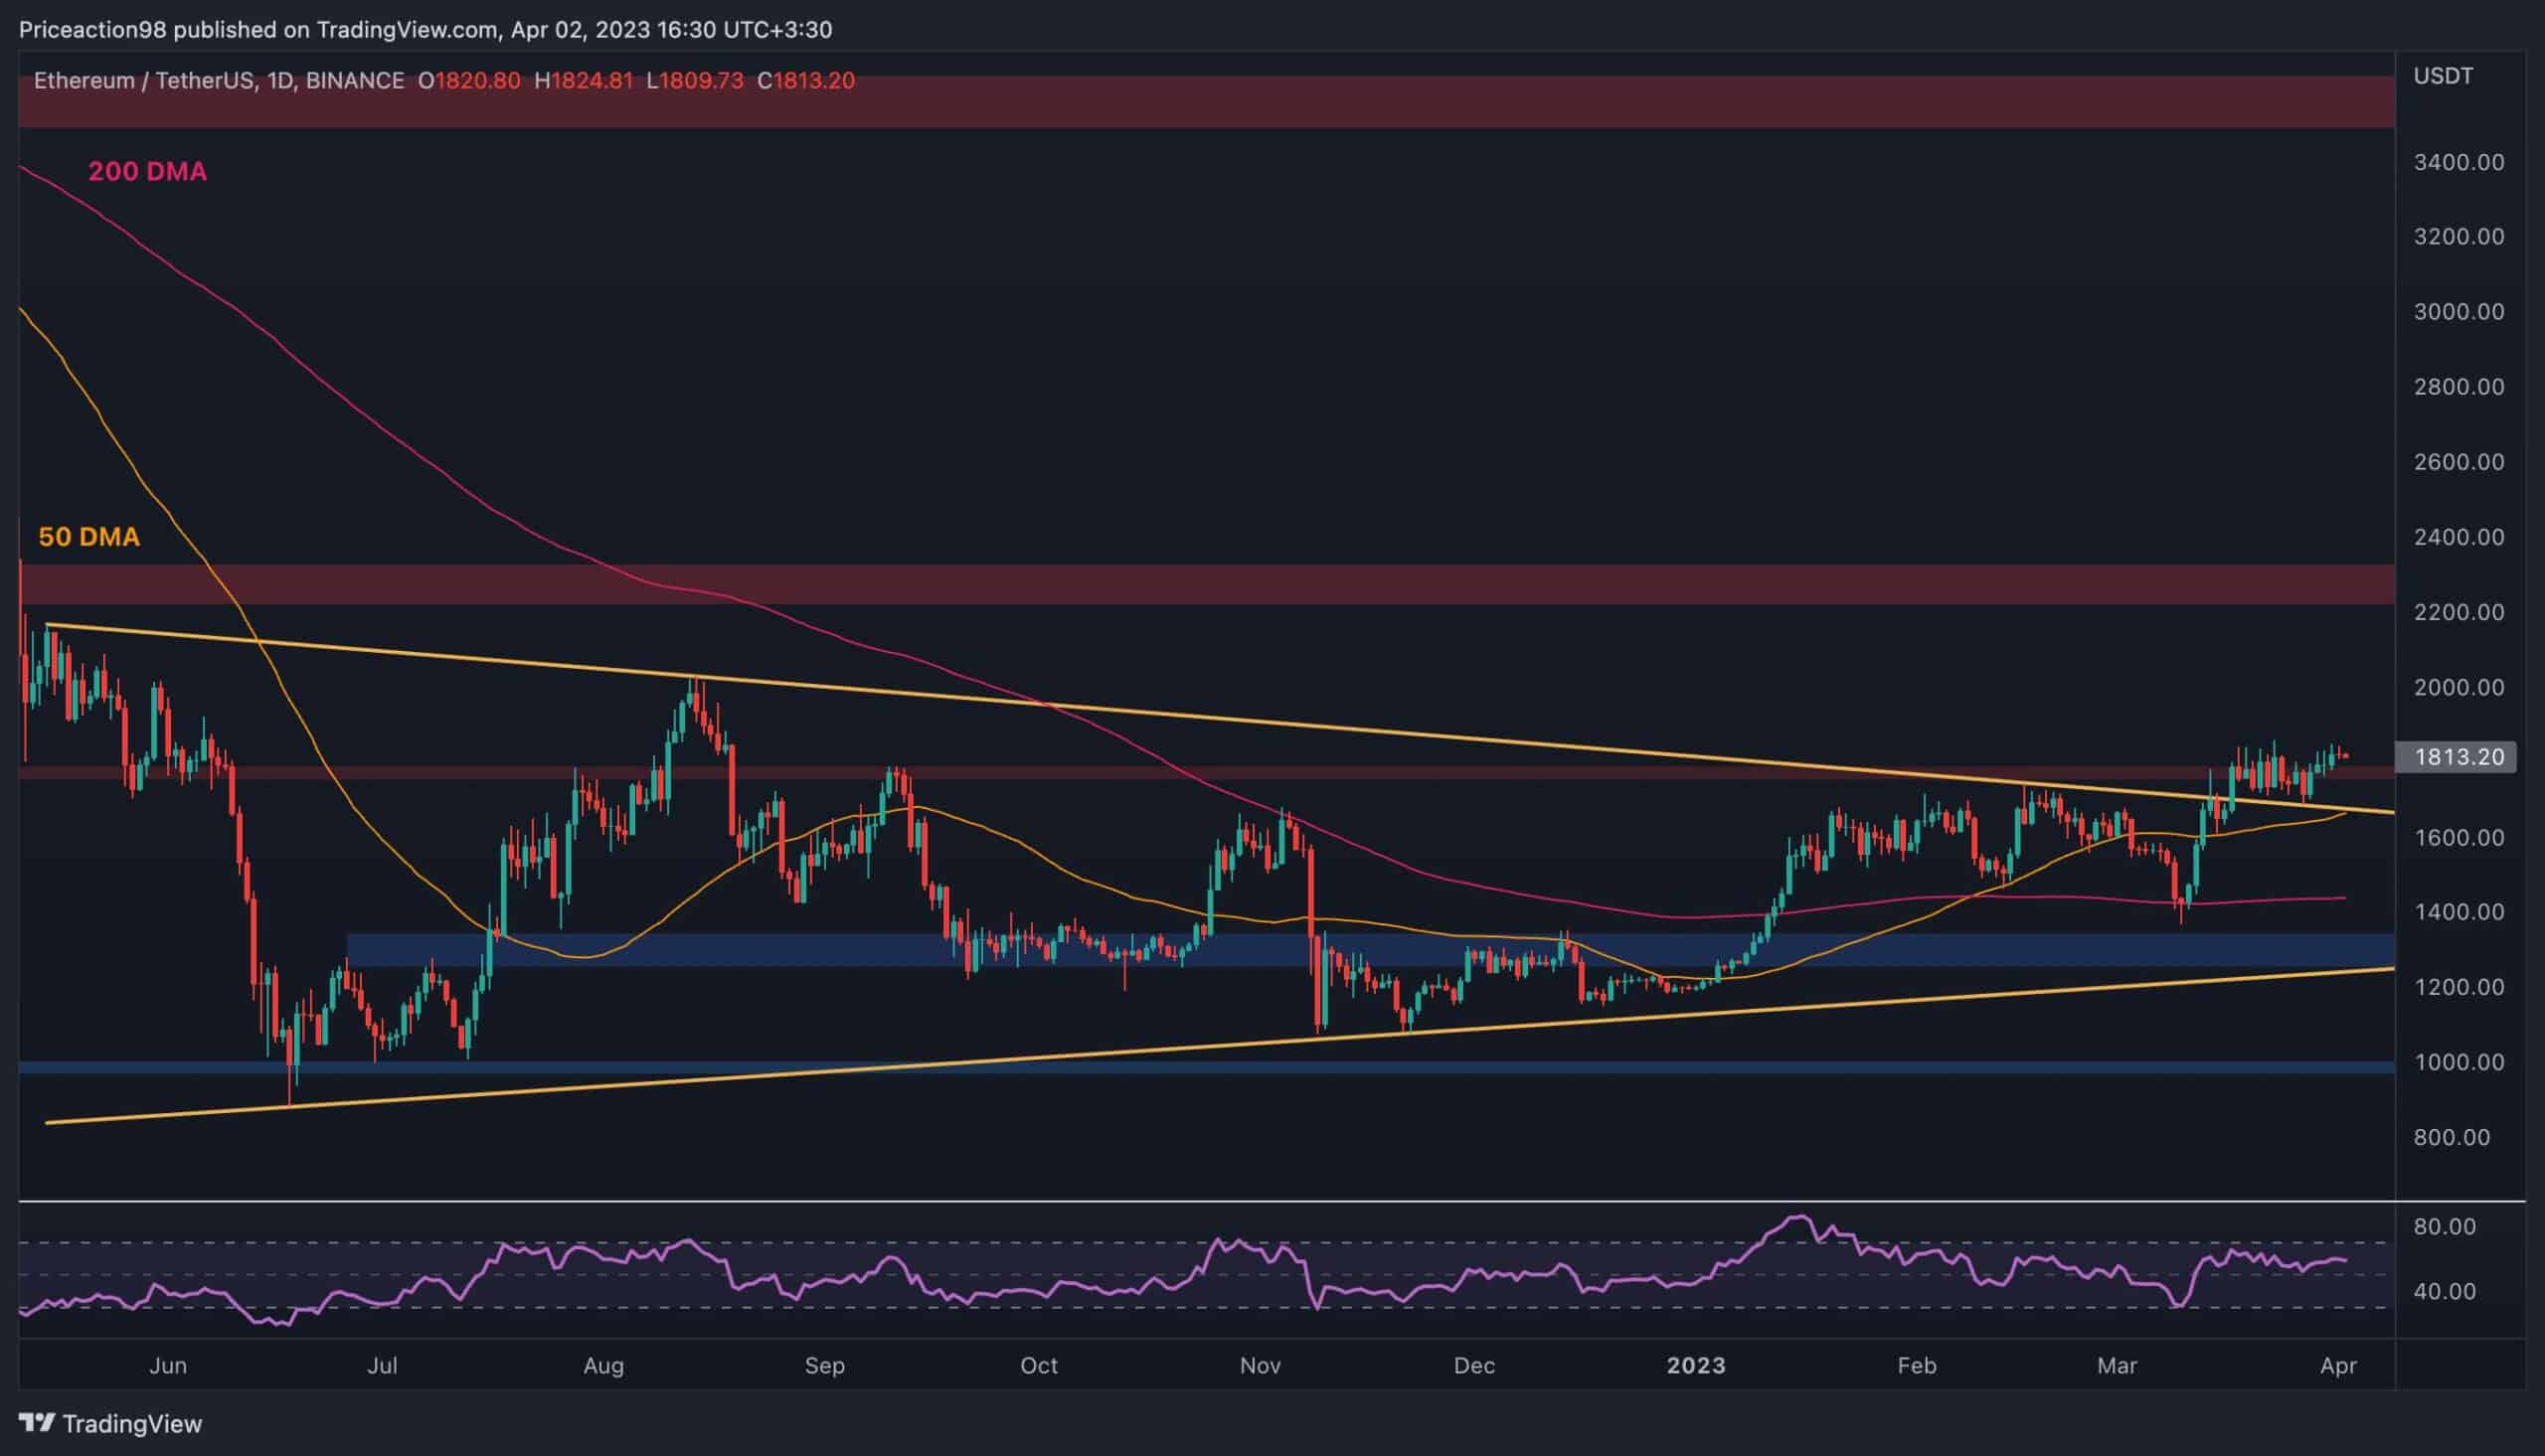
The Daily Chart:
On the daily chart, the price has been holding above the broken symmetrical triangle after breaking it to the upside. However, the $1800 resistance area is yet to be captured, and the price has struggled to advance.
Currently, the market is moving higher slowly after retesting the higher boundary of the symmetrical triangle but is not showing decisive momentum to move away from the $1800 level. If a correction happens in the coming days, the higher trendline of the triangle could be tested once more, followed by the 50-day moving average and the 200-day one, located around the $1700 and $1400 marks, respectively.
On the other hand, if the price finally surges away from the $1800 area, a rally toward the $2300 resistance level could be expected in the short term.
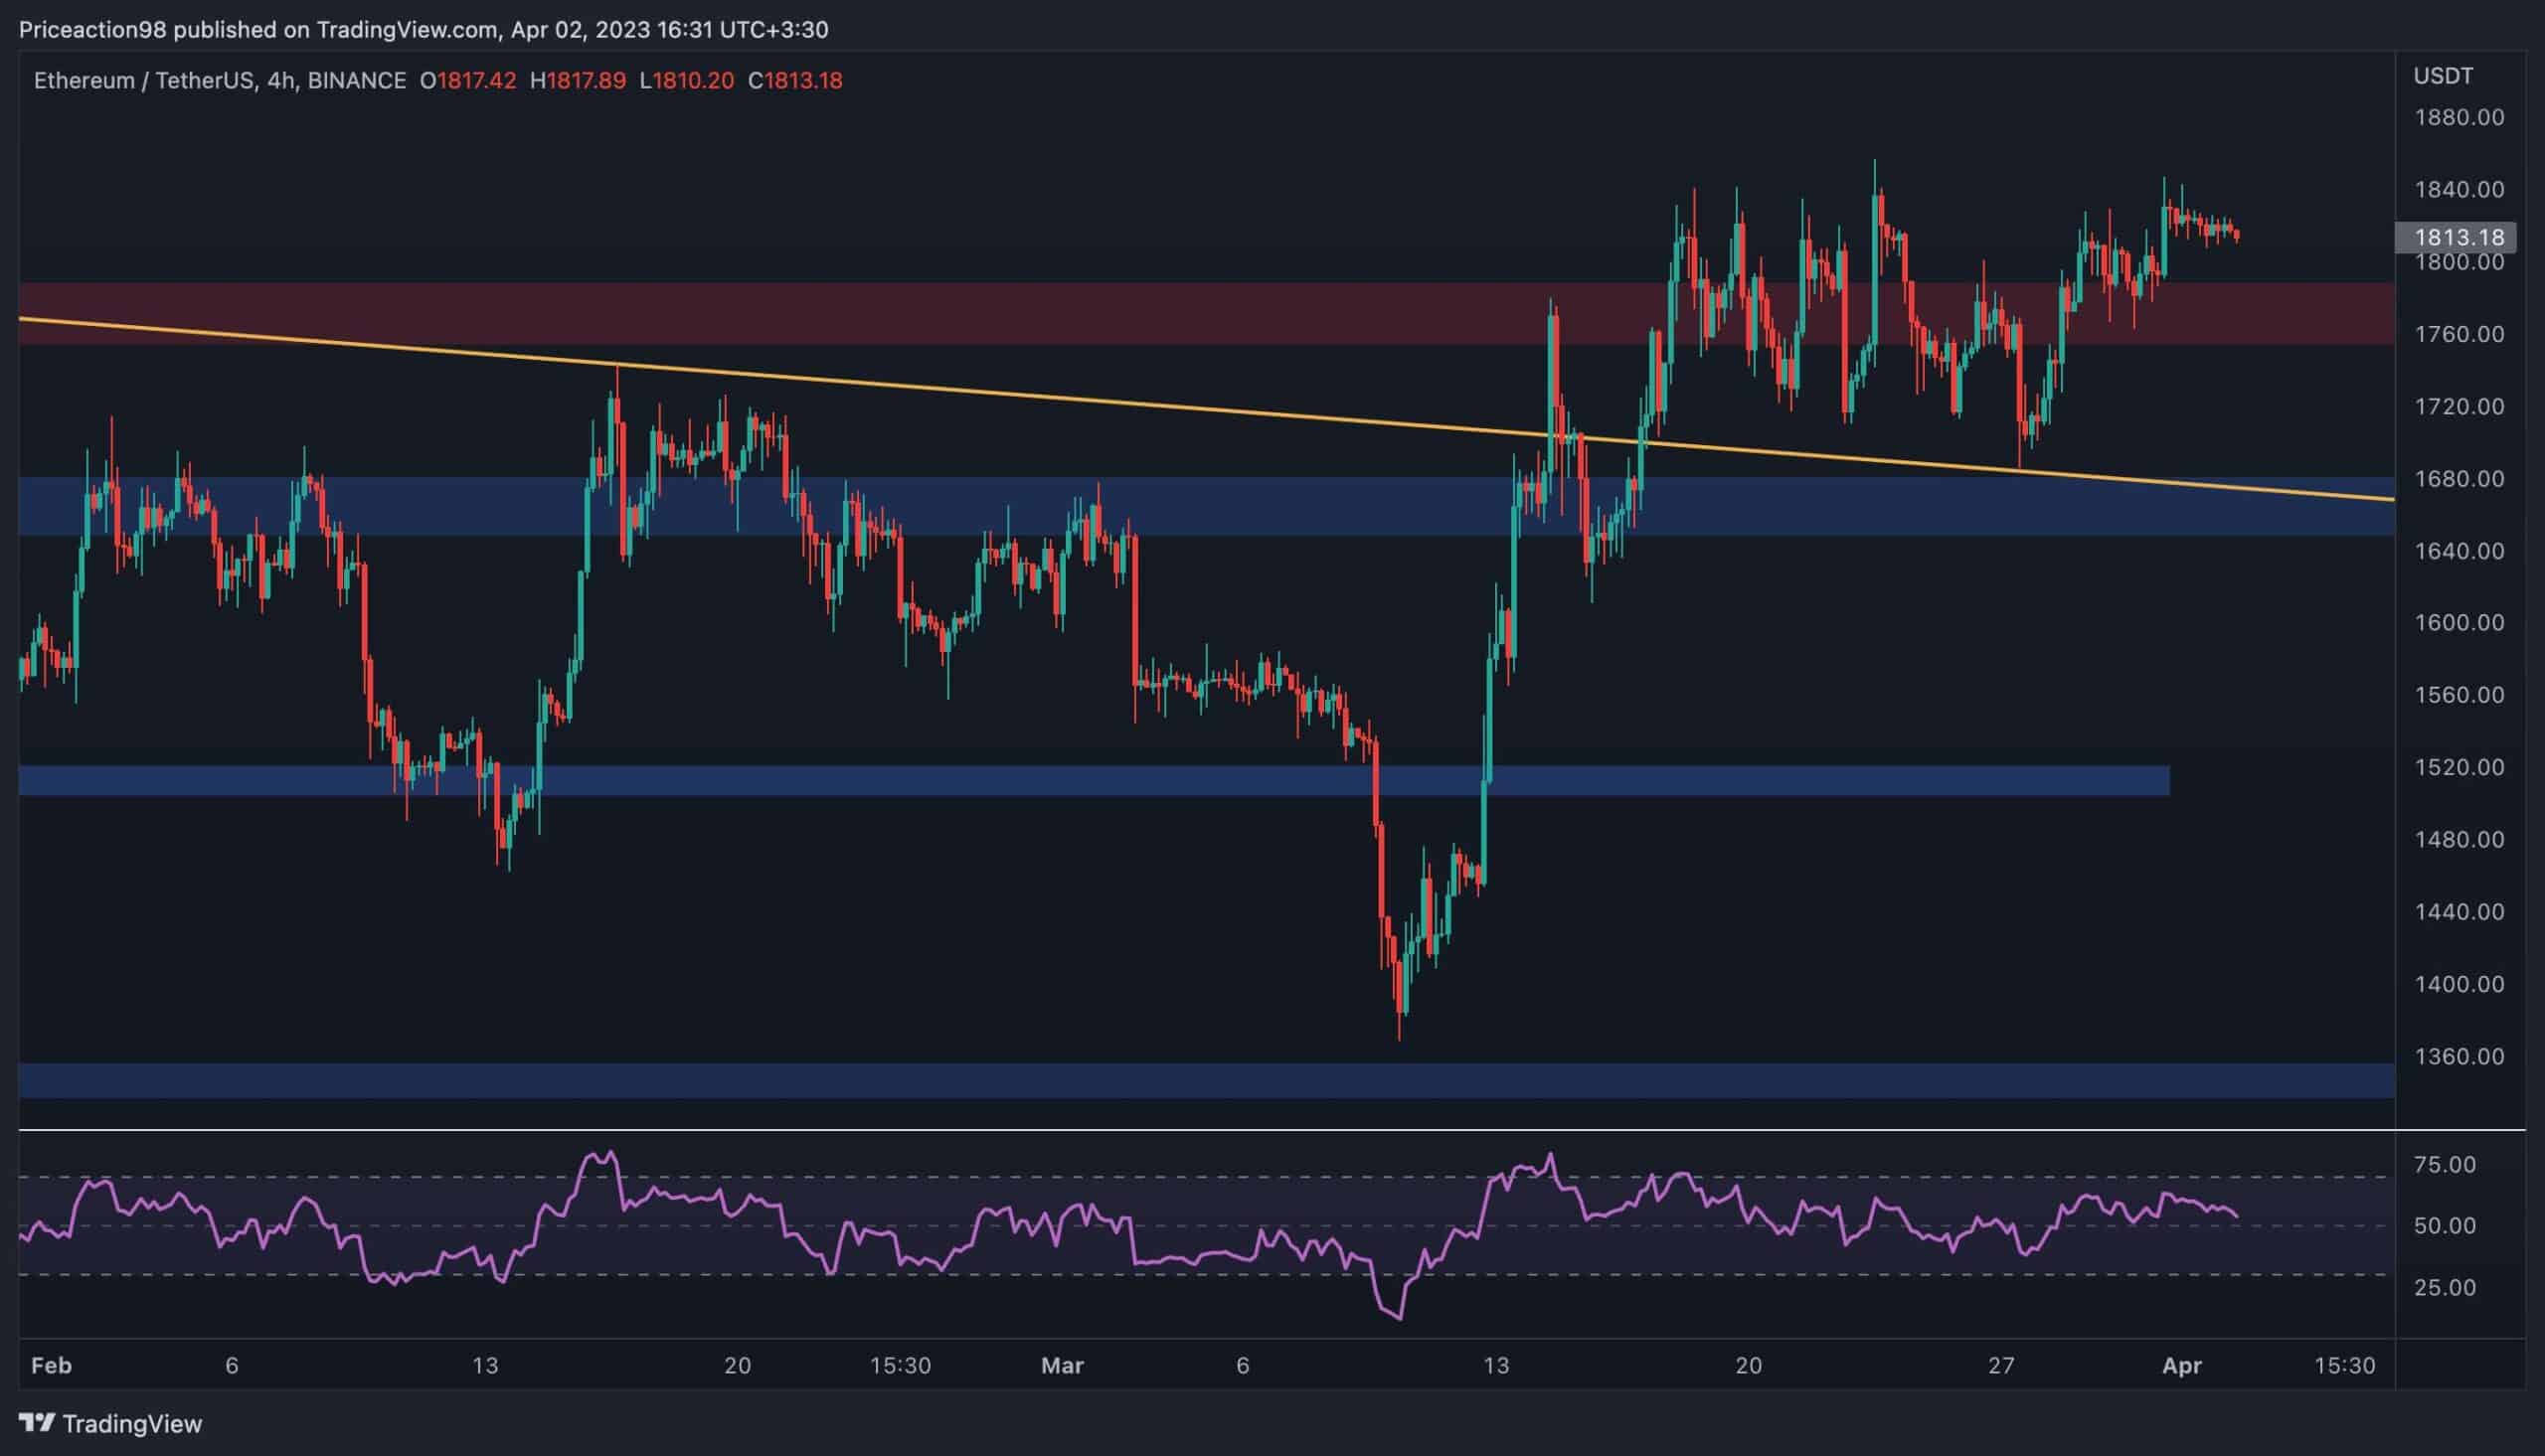
The 4-Hour Chart:
Looking at the 4-hour timeframe, it is evident that the price has been oscillating in a tight range around the $1800 level, showing neither a willingness to break it to the upside nor a rejection lower. The higher trendline of the large triangle pattern could be tested near the $1680 support level if the market drops, and it could provide sufficient support to push the price higher.
Yet, a breakdown of these levels could lead to a drop back towards the key $1500 area. The RSI indicator has also been relatively flat over the past few days while remaining above the 50% threshold.
This signal indicates that while the bulls are still in control, their dominance may be fading, which could lead to a correction in the near future.