Polkadot buyers were unable to surpass the critical resistance at .5, resulting in a significant 7% decline due to increased selling pressure. The cryptocurrency has now reached a decisive support level, and the upcoming price action will be crucial in determining Polkadot’s future trend. Technical Analysis By Shayan The Daily Chart A detailed daily chart analysis reveals that Polkadot buyers failed to reclaim a key resistance zone over several weeks. This zone includes the 100-day moving average at .6 and the price range between the 0.5 (.4) and 0.618 (.8) Fibonacci levels. The resistance is accompanied by substantial supply, likely stemming from aggressive short positions in the perpetual markets. This intensified selling activity led to a 7% plunge in Polkadot’s
Topics:
CryptoVizArt considers the following as important: DOT Analysis, DOTBTC, DOTUSD, DOTUSDT, Polkadot (DOT) Price
This could be interesting, too:
Dimitar Dzhondzhorov writes Top 10 Cryptocurrencies by ‘Notable Development Activity’ (Santiment)
Duo Nine writes Crypto Price Analysis June-29: ETH, XRP, ADA, DOGE, and DOT
Dimitar Dzhondzhorov writes Here’s Why Polkadot (DOT) Might be a ‘Great Mover in the Coming Years:’ Analyst
Duo Nine writes Crypto Price Analysis June-15: ETH, XRP, ADA, DOGE, and DOT
Polkadot buyers were unable to surpass the critical resistance at $7.5, resulting in a significant 7% decline due to increased selling pressure.
The cryptocurrency has now reached a decisive support level, and the upcoming price action will be crucial in determining Polkadot’s future trend.
Technical Analysis
By Shayan
The Daily Chart
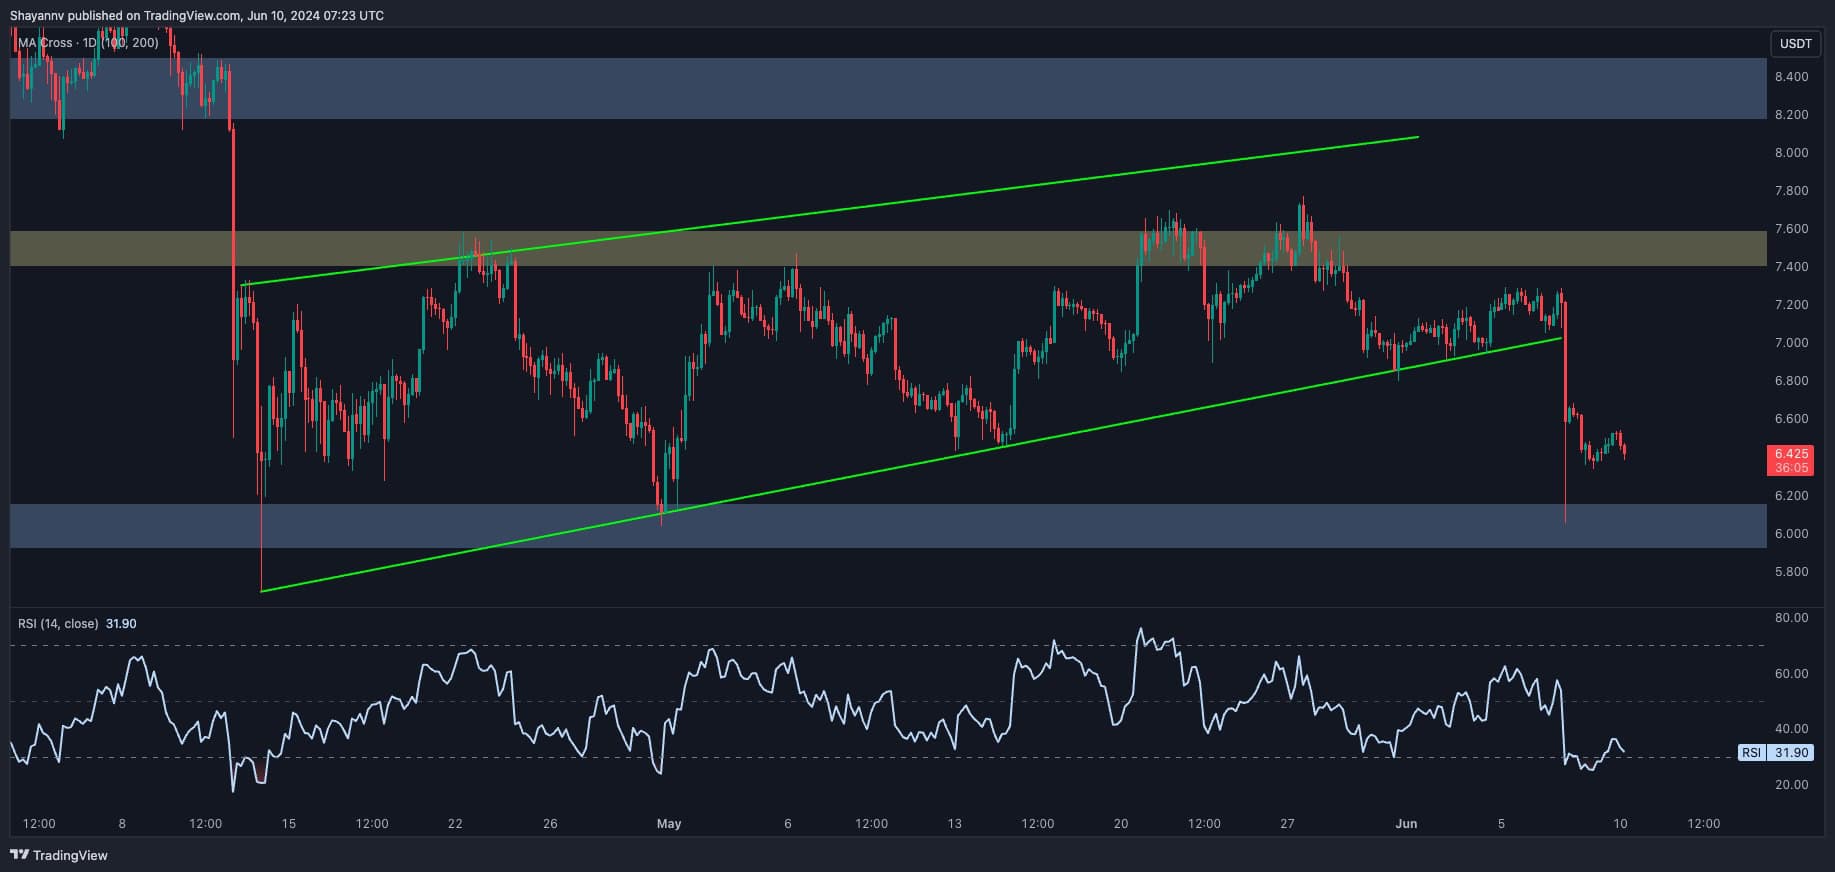
A detailed daily chart analysis reveals that Polkadot buyers failed to reclaim a key resistance zone over several weeks. This zone includes the 100-day moving average at $7.6 and the price range between the 0.5 ($7.4) and 0.618 ($7.8) Fibonacci levels. The resistance is accompanied by substantial supply, likely stemming from aggressive short positions in the perpetual markets.
This intensified selling activity led to a 7% plunge in Polkadot’s price, indicating bearish market sentiment. However, the price has reached a crucial support zone near the $6.5 level.
This range is filled with demand and could counteract the prevailing selling pressure and halt further declines. If this pivotal support is unexpectedly breached, the bearish trend will likely continue in the mid-term.

The 4-Hour Chart
On the 4-hour chart, Polkadot’s price had formed an ascending wedge pattern during the recent multi-month consolidation phase. After facing rejection at the significant $7.5 resistance level, the price declined sharply, breaking through the lower boundary of the wedge. This breakout led to the liquidation of numerous long positions, causing a cascade effect toward the $6.5 mark.
The price has now reached a critical support region around the $6.5 level, which includes prior major daily swing lows. A period of consolidation near this crucial support is likely before the next significant move.
Sentiment Analysis
By Shayan
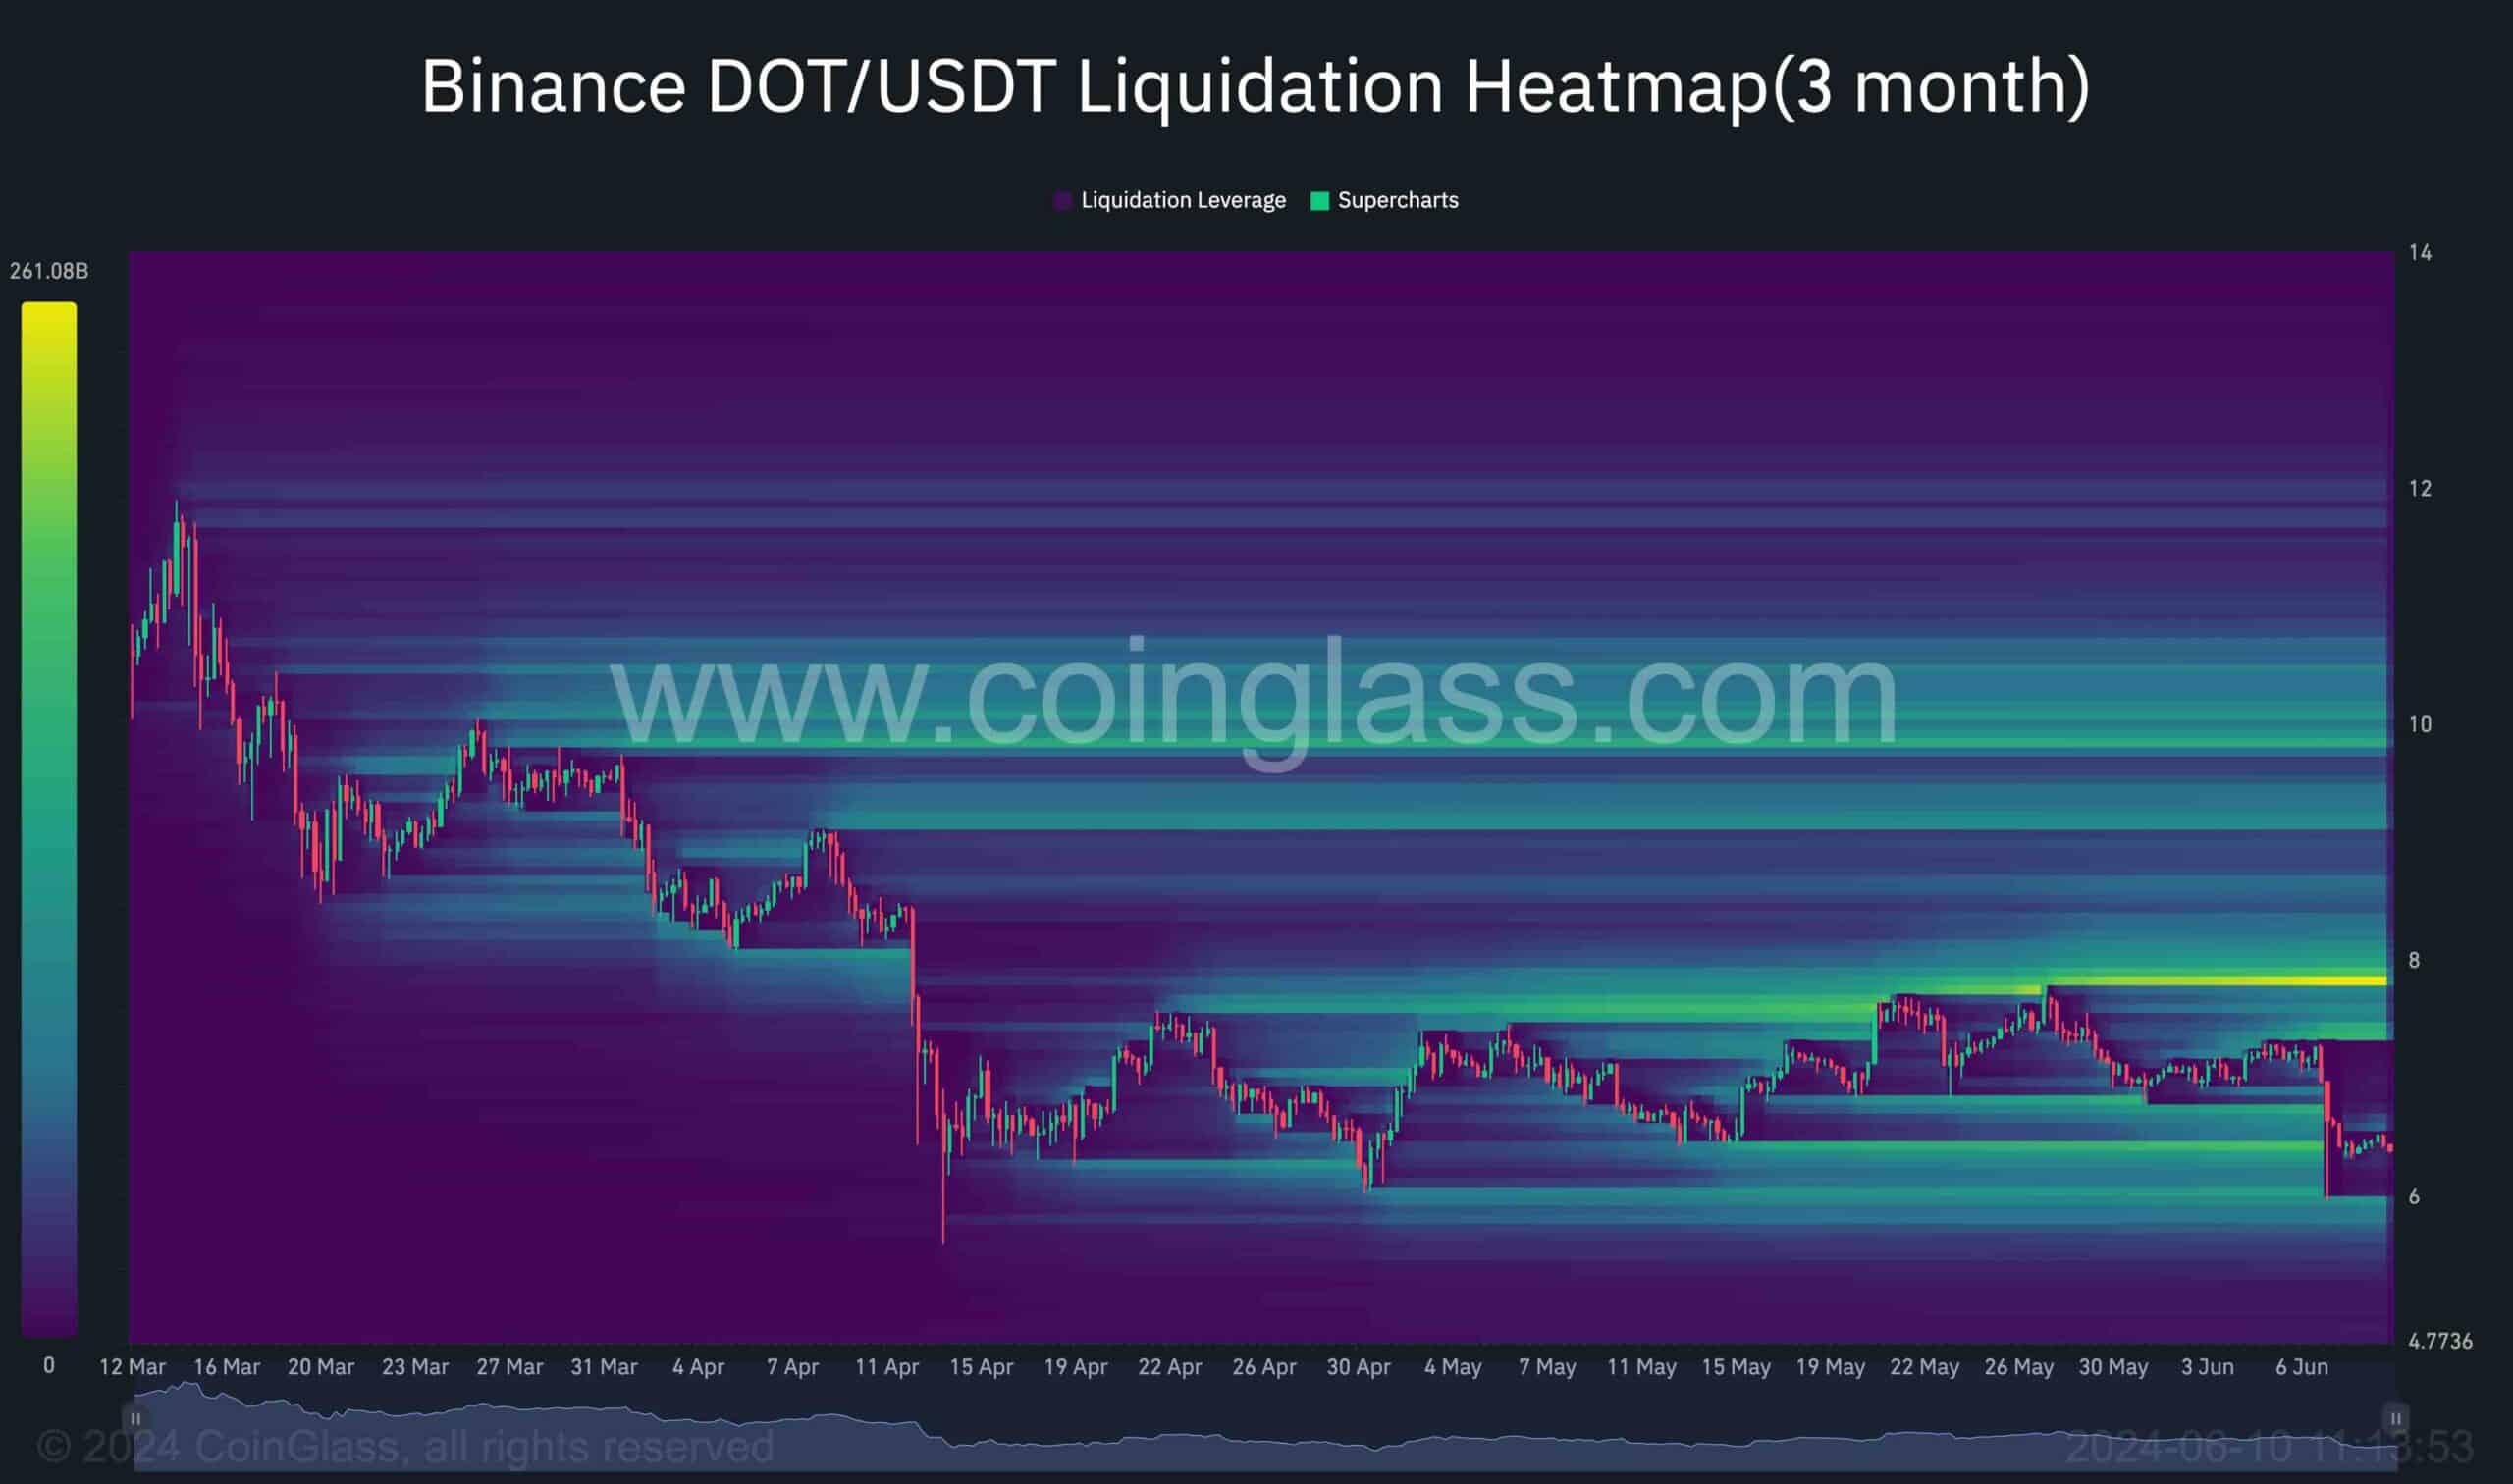
Currently, Polkadot is undergoing a period of slight consolidation near the $6.5 mark after experiencing a significant drop. Analyzing futures market metrics, specifically the DOT/USDT Binance liquidation heatmap, offers valuable insights into potential price movements and liquidity pools.
The heatmap indicates that due to the recent sharp decline, the price has absorbed considerable liquidity, primarily between the $6.5 and $6 marks, leading to the liquidation of many long positions. Notably, there are no substantial liquidity levels below the $6 mark. This typically indicates a cooling-off period in the futures market.
However, there is significant liquidity near the $8 level, suggesting it could act as a resistance level. Therefore, if there’s a bullish resurgence in the mid-term, this zone will likely be the primary target for buyers to reclaim.