Wednesday , May 22 2024
Home / Tag Archives: DOT Analysis

Tag Archives: DOT Analysis

Calm Before the Storm? DOT Eyes This Level to Trigger Mass Liquidations (Polkadot Price Analysis)

Polkadot’s recent price action has been characterized by steady but uncertain movements within a defined range, highlighting a balance between buyers and sellers. However, a decisive breakout from this range is imperative to determine its future trajectory. Technical Analysis By Shayan The Daily Chart On the daily chart, Polkadot has been trapped within a defined range, with the $6 support and the $7.5 resistance serving as significant boundaries. This sideways movement...

Read More »

Is Polkadot Bound for a Massive Move Following Consolidation Around $7? (DOT Price Analysis)

Following a bounce from the lower boundary of the current price range at $6.4, Polkadot experienced a surge, reaching the upper threshold, coinciding with a significant resistance area. Consequently, a slight rejection is anticipated, with the price targeting the lower part of the range. Technical Analysis By Shayan The Daily Chart Upon close examination of the daily chart, Polkadot is observed to be moving sideways, oscillating between the notable support level of $6.4 and...

Read More »

Crypto Price Analysis May-03: ETH, XRP, ADA, SHIB, and DOT

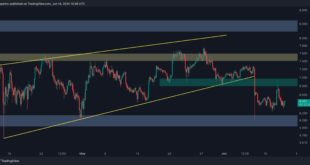
This week, we take a closer look at Ethereum, Ripple, Cardano, Shiba Inu, and Polkadot. Ethereum (ETH) Ethereum broke under $3,000 and closes this week with a 5% loss. This latest crash in the price made a lower low which shows bears are still in control of the price action. The current support is at $2,900 and buyers have to protect this level at all costs. If they fail, then the next major support will be found at $2,500. Looking ahead, ETH was quickly rejected at the...

Read More »

Polkadot Price Analysis: Has DOT Bottomed and is $9 the Next Target?

Polkadot’s price has been on the decline for a while now, since reversing to the downside in March, Yet, the market might recover soon. Technical Analysis By TradingRage The Daily Chart On the daily chart, DOT’s price has been making lower highs and lows since being rejected from the $12 resistance level. The $9 mark has also been broken to the downside. The price is currently trading below the 200-day moving average, which is located around $7.2. Yet, it is testing the...

Read More »

Polkadot Price Analysis: DOT Tumbles 7% Weekly but the Bulls May Be Staging a Comeback

Polkadot’s price has been dropping rapidly over the last couple of months and is yet to show any sign of slowing down. However, the cryptocurrency might soon begin a bullish rebound. Technical Analysis By TradingRage The Daily Chart On the daily chart, the price has been on an aggressive decline since a rejection from the $12 resistance level. The market has also broken below the bullish trendline that has been formed since October 2023. The 200-day moving average, located...

Read More »

Is Polkadot Primed for a Major Move Following Extended Consolidation? (DOT Price Analysis)

Polkadot has been undergoing a prolonged corrective consolidation around the critical $6.5 support level, with the price retracing slightly toward the 100-day moving average. However, the short-term expectation is to continue this corrective consolidation phase. Polkadot Price Analysis: Technicals By Shayan The Daily Chart A comprehensive analysis of the daily chart shows a swift rebound near the pivotal support level of $6.5, with the price exhibiting a minor bullish...

Read More »

Polkadot Price Analysis: DOT Consolidates in Critical Area as Bulls Eye $9 Push

Polkadot’s recent price movement has seen it finding support from the crucial 200-day moving average, prompting a bullish retracement. However, despite this upward trajectory, the cryptocurrency faces several critical resistance levels ahead, casting doubt on the sustainability of the bullish retracement. Technical Analysis By Shayan The Daily Chart A thorough daily chart analysis reveals a modest bullish reversal near the key 200-day moving average of $7, following a quick...

Read More »

Crash to $6 or Surge to $8: Which Comes First for Polkadot? (DOT Price Analysis)

Polkadot’s recent price action has been characterized by subdued movement and minimal volatility following a swift decline toward the $6 level. However, the cryptocurrency finds itself at a crucial juncture, with a potential breakout poised to determine its next direction. Polkadot Price Analysis: Technicals By Shayan The Daily Chart A thorough analysis of the daily chart reveals a period of consolidation around the $6 mark, marked by low volatility and indecision in the...

Read More »