DASH is showing strength across trading pairs with 4.5% growthThe long-term bullish trend could continue once DASH reclaims the monthly highDASH may drop if the XABCD harmonic pattern completesDASH/USD: Buyers Target 7 To Complete Butterfly Pattern – Possible Bearish Reversal In SightKey Resistance Levels: 7, 0Key Support Levels: 3, Following the latest mild bearish scenario in the crypto space, DASH is currently up by 4.44% against the US Dollar. This marks a small increase from 5 -0 over the past few hours, but DASH’s price has now dropped to 3 at the moment. Despite that, the 16th largest cryptocurrency on the market is still poised for an upward move.Although the momentum has been quite slow and steady for a while now, DASH is almost completing a XABCD harmonic
Topics:
Michael Fasogbon considers the following as important: Price Analysis
This could be interesting, too:
CryptoVizArt writes ETH’s Path to K Involves Maintaining This Critical Support (Ethereum Price Analysis)
Duo Nine writes Crypto Price Analysis June-29: ETH, XRP, ADA, DOGE, and DOT
Duo Nine writes Crypto Price Analysis June-15: ETH, XRP, ADA, DOGE, and DOT
Duo Nine writes Why is the Shiba Inu (SHIB) Price Down Today?
- DASH is showing strength across trading pairs with 4.5% growth
- The long-term bullish trend could continue once DASH reclaims the monthly high
- DASH may drop if the XABCD harmonic pattern completes
DASH/USD: Buyers Target $137 To Complete Butterfly Pattern – Possible Bearish Reversal In Sight
Key Resistance Levels: $137, $150
Key Support Levels: $113, $97
Following the latest mild bearish scenario in the crypto space, DASH is currently up by 4.44% against the US Dollar. This marks a small increase from $115 -$130 over the past few hours, but DASH’s price has now dropped to $123 at the moment. Despite that, the 16th largest cryptocurrency on the market is still poised for an upward move.
Although the momentum has been quite slow and steady for a while now, DASH is almost completing a XABCD harmonic pattern – a bearish butterfly on the 4-hours chart. Another essential thing to pay attention to is the current volume is decreasing as the price goes up. Even if the bullish sentiment continues, DASH might need to look for a healthy rebound level to pace higher.
DASH Price Analysis
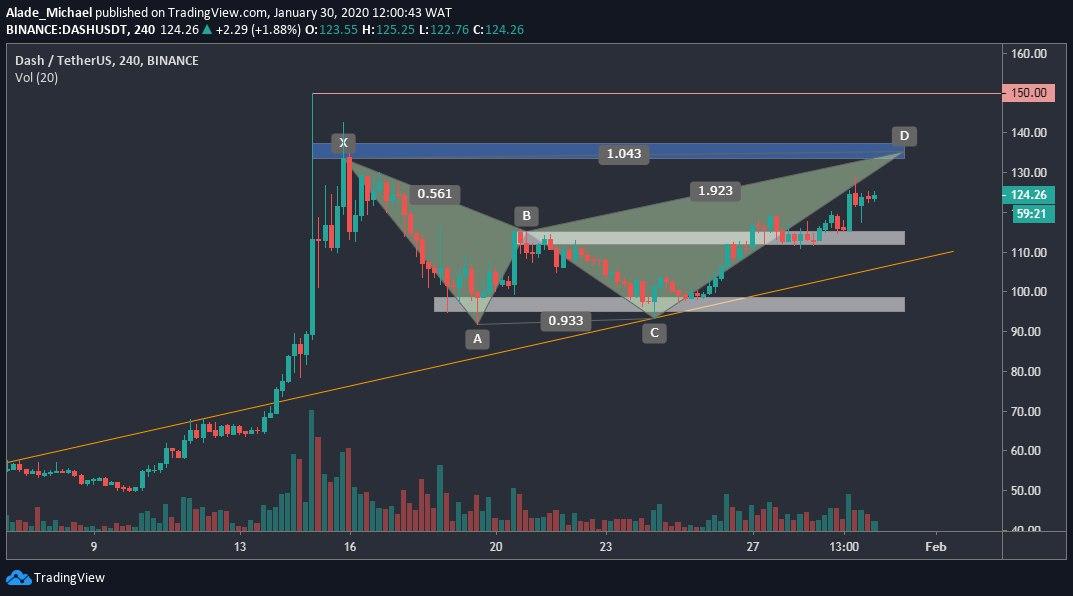
DASH is slowly bouncing back after retracing almost 50% from $150. The correction level of $91 is now producing a butterfly pattern to the ‘D’ point with the support of the orange rising trend line. Once this XABCD harmonic pattern completes at the blue resistance zone of $137, the price of DASH could retrace back to the $113 support – right in the immediate white zone. From there, the market could bounce back.
If a bounce fails, DASH might extend the correction to the lower white zone of $97 – the last defense line for the bulls. A break at this defense line may cause a devastating drop in the short-term.
At $137 resistance, DASH could close up gains to $150 resistance if the buyers show further commitment. Reclaiming this resistance may set DASH on fire once again. Considering the current volume, as shown on the price chart, the bears may gain control if it continues to fade away.
DASH/BTC: DASH Reaching a BreakPoint on Wedge Pattern, Where To?
While Bitcoin shows weakness over the last 24-hours, DASH is correcting gains of about 4.46% at the time of this writing.
This shows that the bulls are gradually returning. Looking at the chart, it appears that DASH is maintaining the same pattern with Bitcoin. However, the price is captured in a rising wedge – a bullish trend, even though the setup may look bearish. A breakout would tell the next actual direction of the market.
DASH Price Analysis
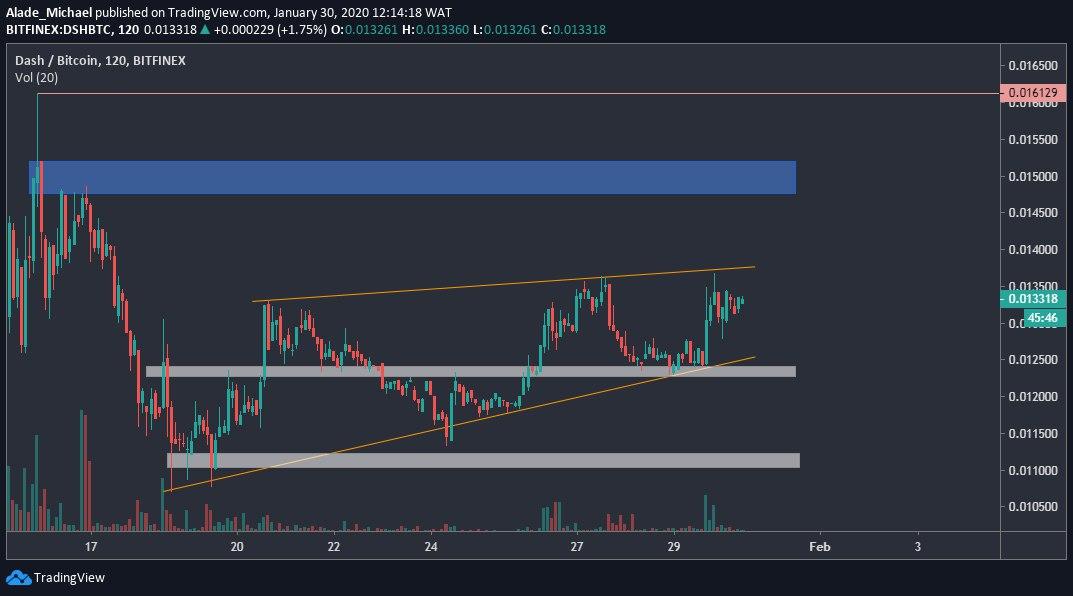
DASH is trapped in a rising wedge following a bullish bounce from the 0.0107SAT level on January 19. After a ten days climb, the price of DASH is now reaching a breakpoint on the wedge pattern. At the moment, DASH is roaming around the 0.0132SAT level following a small drop from the wedge’s resistance.
The bears are now aiming the white support area of 0.0124SAT level, around the wedge’s lower boundary. A drive beneath this wedge could send the price back to the January 19 low of $0.0107SAT level. The bears might take over this market if DASH further dips beyond the second white zone. Considering a wedge break up, however, DASH would target the blue area of $0.0150SAT level in no time. Further surge should allow buyers to reclaim the 0.01612SAT level and beyond.