ETH/USD – Ethereum Bulls Print Fresh 2020 Highs Above 0Key Support Levels: 0, 0, 5.Key Resistance Levels: 0, 2, 0.Yesterday, Ethereum finally penetrated beyond the 5 resistance provided by a bearish .786 Fib Retracement. It managed to spike above 0, but the bears stepped in to cause the daily candle to close around 0.Today, the ETH bulls continue to drive further higher as they penetrated beyond 0 again to reach as high as 8. It has since dropped slightly as the buyers battle to break the 3 resistance (1.414 Fib Extension). In any case, the cryptocurrency increased substantially from yesterday’s low at 5.ETH/USD Daily Chart. Source: TradingViewETH-USD Short Term Price PredictionLooking ahead, if the bulls break 3, the first level of strong
Topics:
Yaz Sheikh considers the following as important: ETH Analysis, ETHBTC, Ethereum (ETH) Price, ethusd
This could be interesting, too:
Mandy Williams writes Ethereum Derivatives Metrics Signal Modest Downside Tail Risk Ahead: Nansen
Jordan Lyanchev writes Weekly Bitcoin, Ethereum ETF Recap: Light at the End of the Tunnel for BTC
CryptoVizArt writes Will Weak Momentum Drive ETH to .5K? (Ethereum Price Analysis)
Jordan Lyanchev writes Bybit Hack Fallout: Arthur Hayes, Samson Mow Push for Ethereum Rollback
ETH/USD – Ethereum Bulls Print Fresh 2020 Highs Above $700
Key Support Levels: $720, $700, $675.
Key Resistance Levels: $750, $762, $780.
Yesterday, Ethereum finally penetrated beyond the $675 resistance provided by a bearish .786 Fib Retracement. It managed to spike above $700, but the bears stepped in to cause the daily candle to close around $680.
Today, the ETH bulls continue to drive further higher as they penetrated beyond $700 again to reach as high as $738. It has since dropped slightly as the buyers battle to break the $733 resistance (1.414 Fib Extension). In any case, the cryptocurrency increased substantially from yesterday’s low at $625.
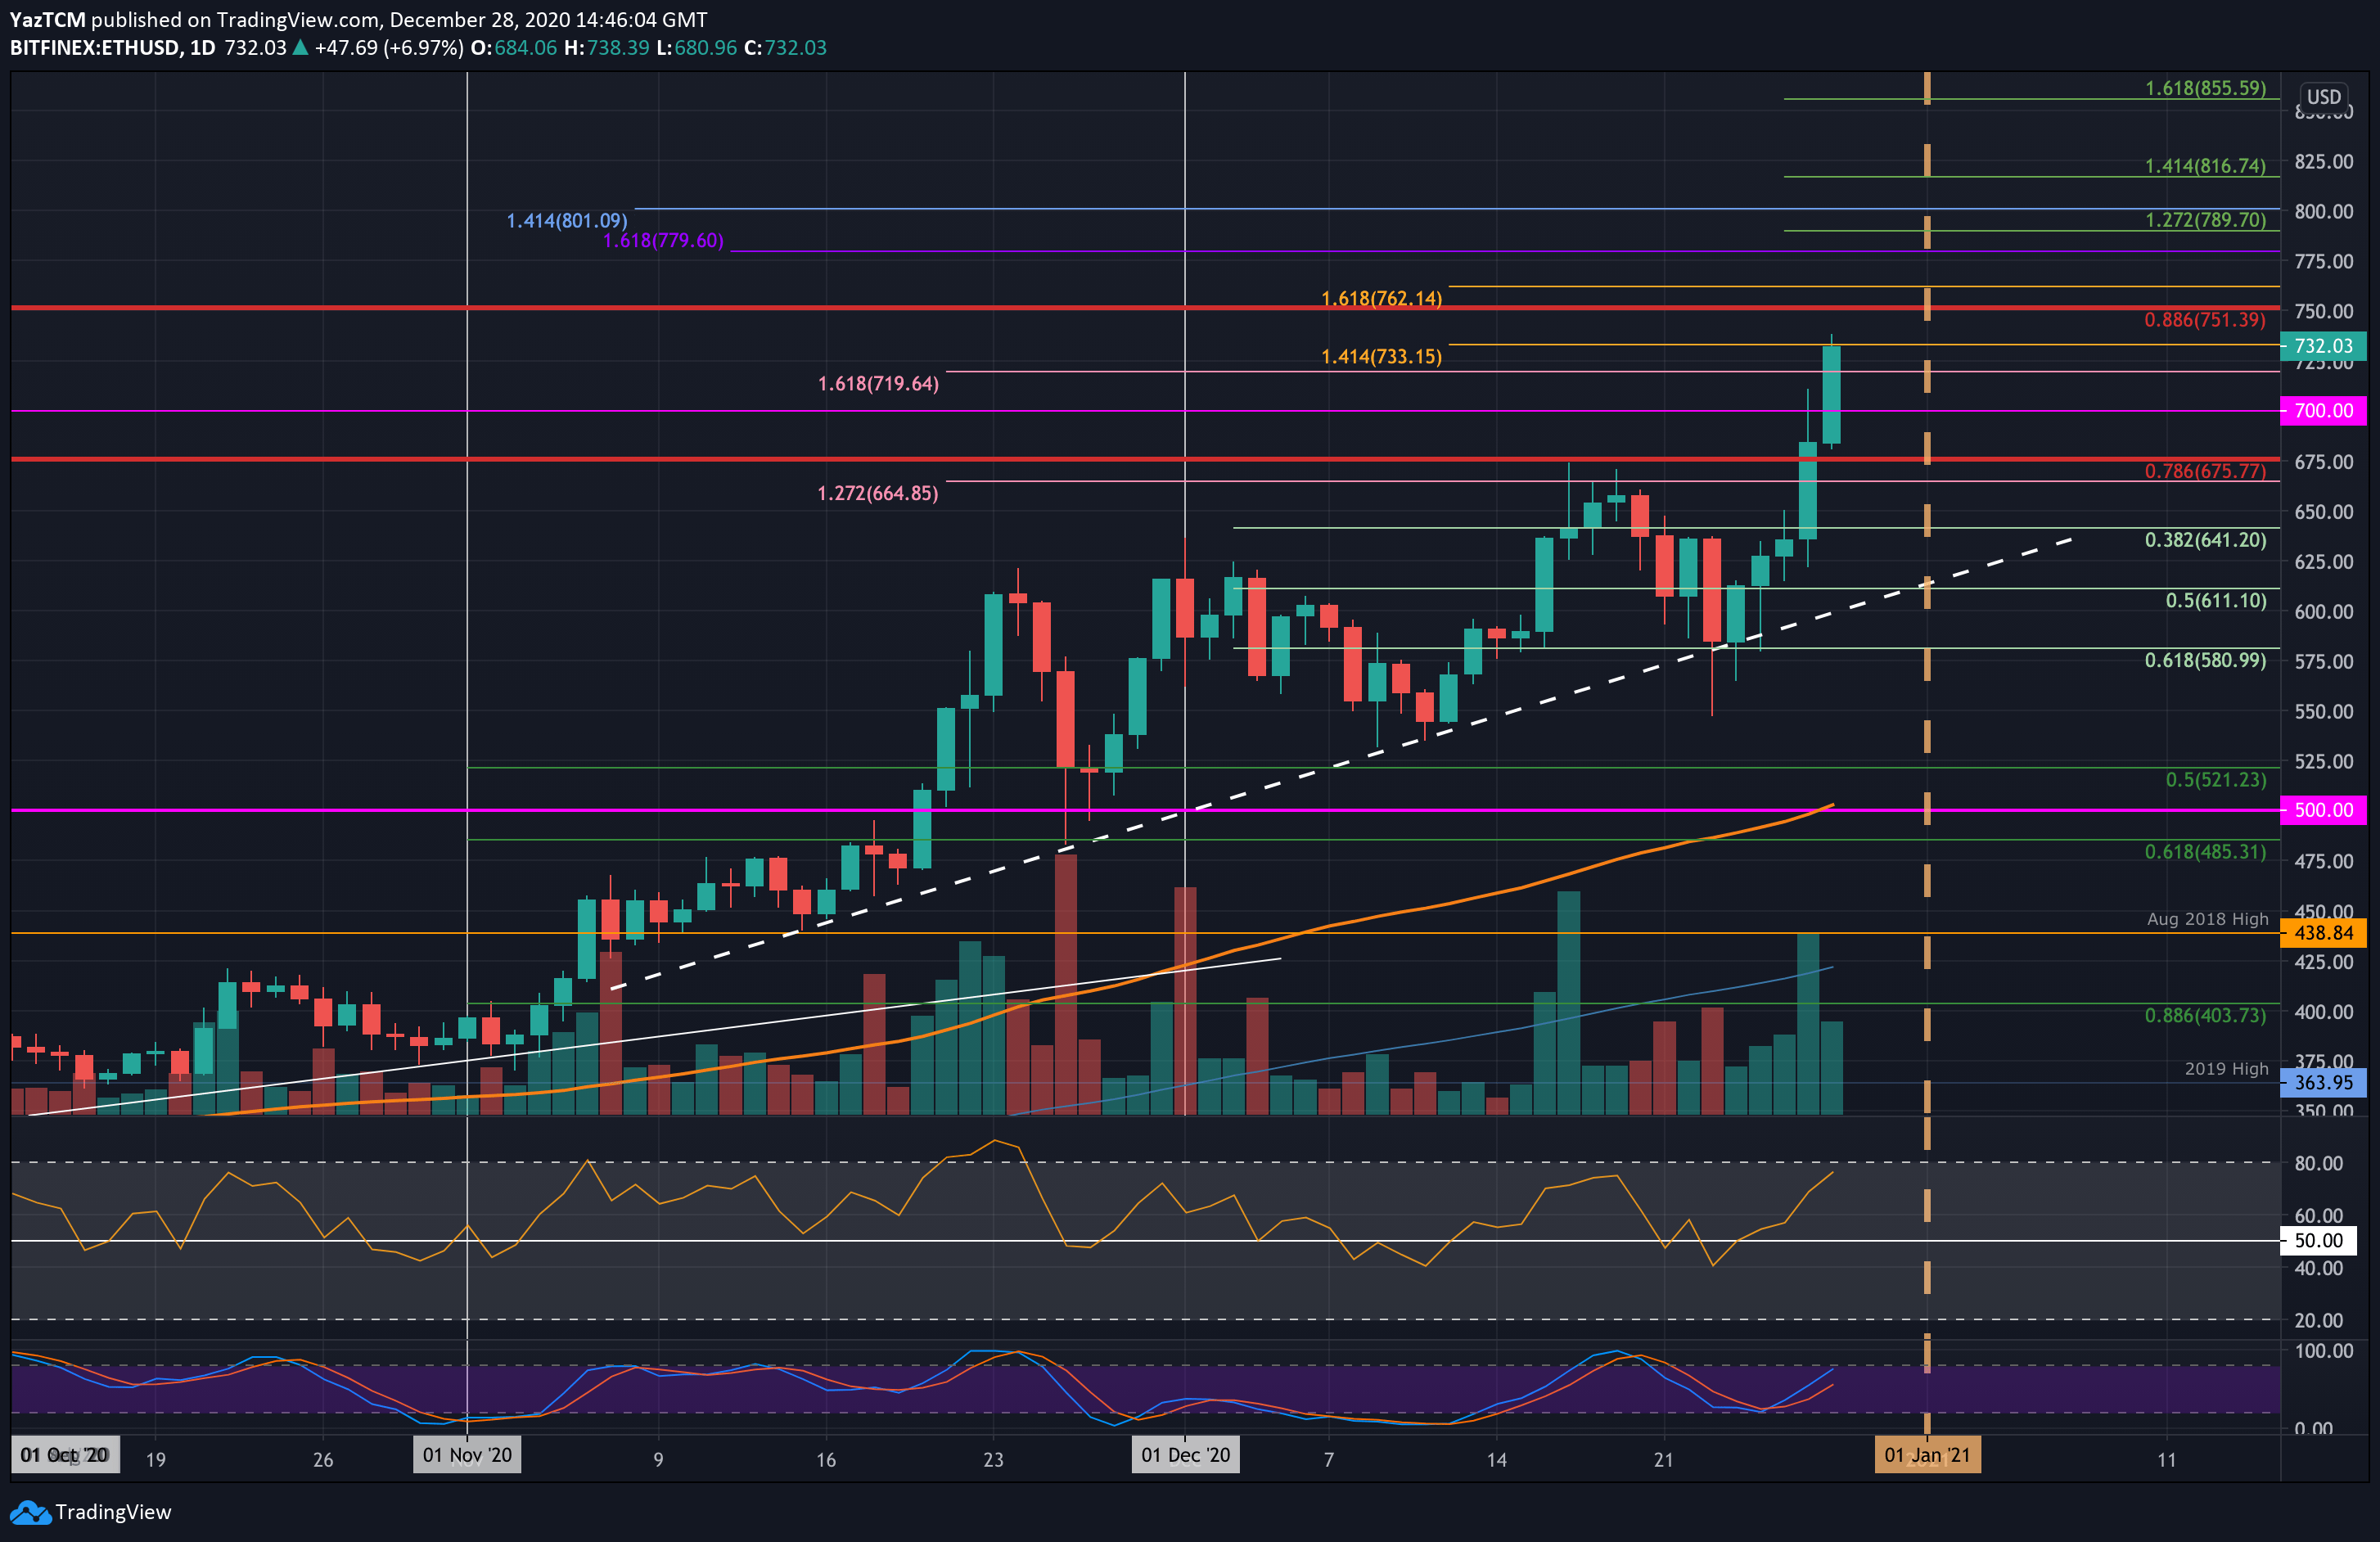
ETH-USD Short Term Price Prediction
Looking ahead, if the bulls break $733, the first level of strong resistance lies at $750 (bearish .886 Fib Retracement). This is followed by $762, $780, $790 (1.272 Fib Extension), and $800.
On the other side, the first level of support lies at $720. After that, there’s $700, $675, $665, and $641 (.382 Fib).
The RSI is above the mid-line as the buyers dominate the market momentum and are still far from being overbought. Additionally, the Stochastic RSI produced a bullish crossover signal a few days ago and still has room to continue further before becoming overbought.
ETH/BTC – ETH Continues Rebound From 0.024 BTC.
Key Support Levels: 0.0262 BTC, 0.026 BTC, 0.025 BTC.
Key Resistance Levels: 0.027 BTC, 0.0275 BTC, 0.028 BTC.
Against Bitcoin, Ethereum had dropped into the 0.024 BTC support yesterday, where it managed to rebound higher. In fact, ETH briefly dropped beneath 0.023 BTC yesterday, but the buyers regrouped to allow the daily candle to close above 0.026 BTC.
Today, the bulls continued to drive ETH higher as they penetrated back above the November lows 0.0262 BTC to reach as high as 0.0275 BTC. The sellers have since dropped the price as ETH now trades near the 0.0269 BTC resistance (bearish .382 Fib Retracement).
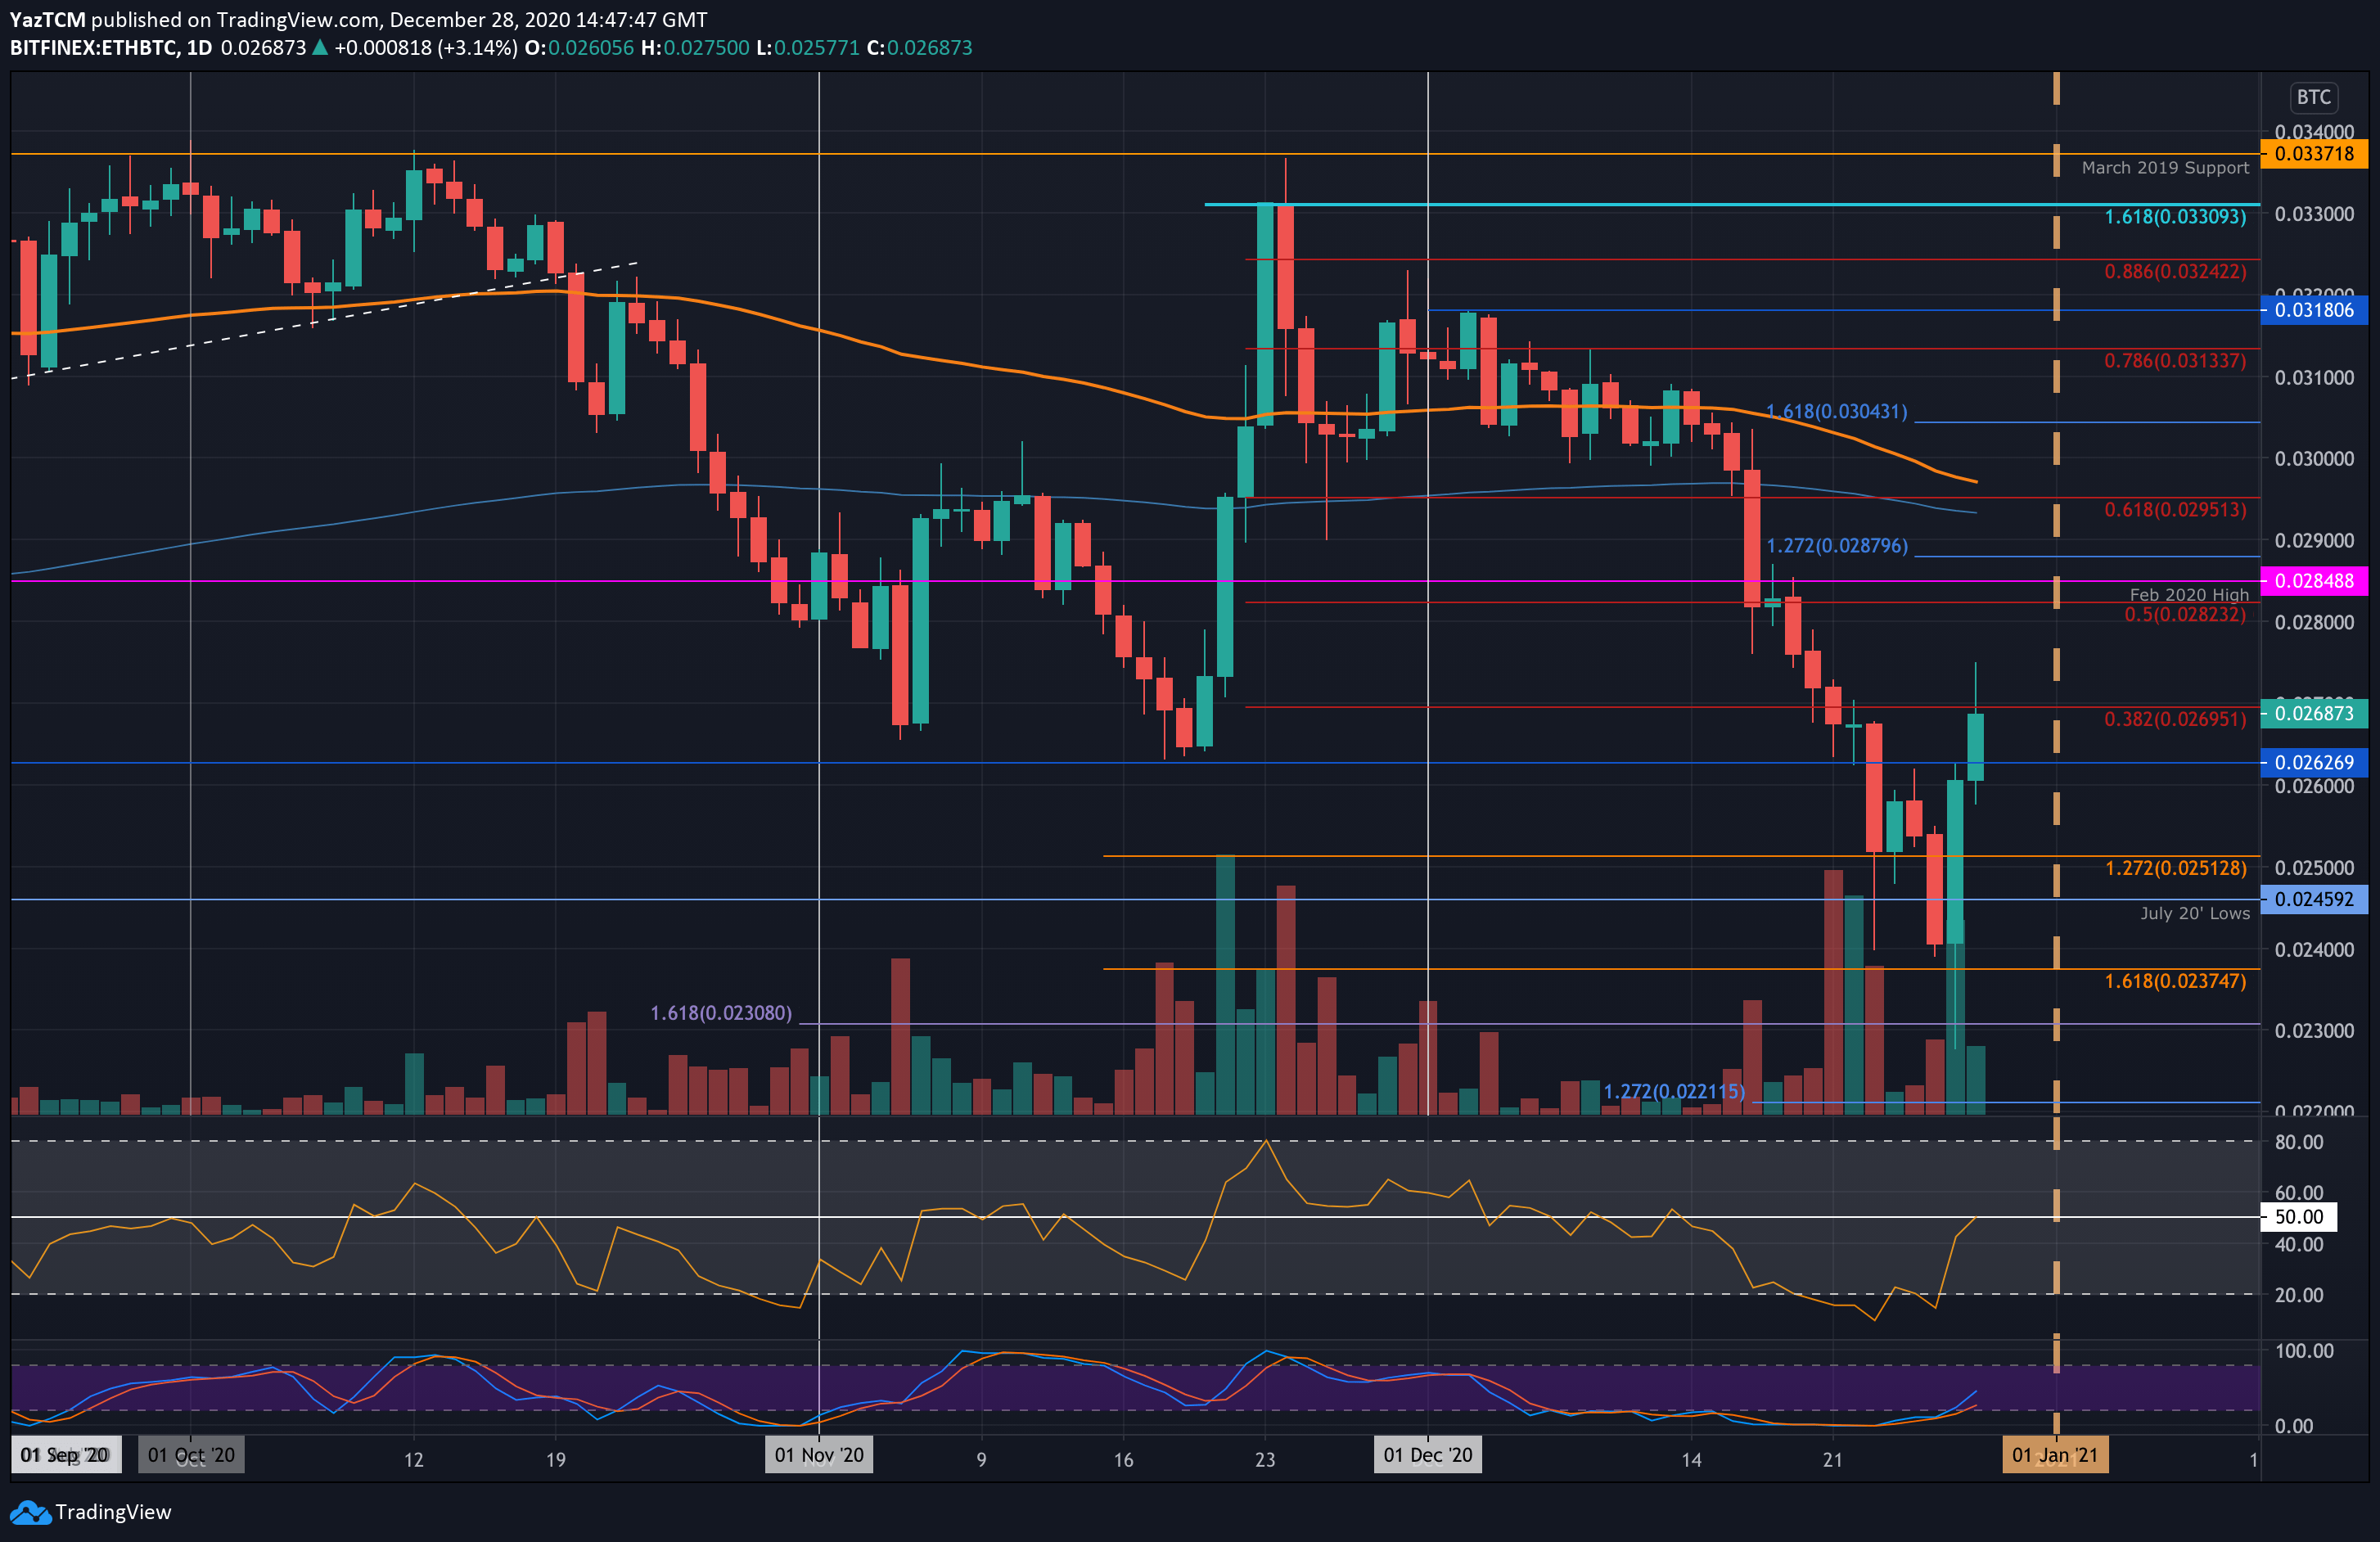
ETH-BTC Short Term Price Prediction
Beyond 0.027 BTC, the first level of resistance is expected at 0.0275 BTC. This is followed by 0.028 BTC, 0.0282 BTC (bearish .5 Fib), and 0.0284 BTC (Feb 2020 highs). Added resistance lies at 0.0287 BTC and 0.0295 BTC.
On the other side, the first level of support lies at 0.0262 BTC. This is followed by 0.026 BTC, 0.025 BTC, and 0.0245 BTC (Jul 2020 lows). Added support lies at 0.024 BTC and 0.0237 BTC.
The RSI is at the mid-line as indecision looms within the market. It will need to cross this line for the bullish momentum to take control of the market movement. The Stochastic RSI recently produced a bullish crossover signal, which is a promising signal for ETH holders.