Key Support level: ,969 Key Resistance level: ,460 The bulls are attempting another break above the all-time high after the shakeout from 27th October which saw the market take a downturn. After the short-lived correction last week, ETH recovered quickly and has maintained a price above the ,969 support level. This is a show of strength from the bulls and the bears need to return in force if they stand any chance of reversing this momentum. Chart by TradingViewETH Price Technical Indicators Trading Volume: The recovery from the breakdown last week was on good volume and it has maintained steady since. A push above the all-time high can lead to an explosion in volume and volatility equally. RSI: The RSI has maintained its level just under 70 points on the daily
Topics:
Duo Nine considers the following as important: ETH Analysis, ETHBTC, Ethereum (ETH) Price, ethusd
This could be interesting, too:
Mandy Williams writes Ethereum Derivatives Metrics Signal Modest Downside Tail Risk Ahead: Nansen
Jordan Lyanchev writes Weekly Bitcoin, Ethereum ETF Recap: Light at the End of the Tunnel for BTC
CryptoVizArt writes Will Weak Momentum Drive ETH to .5K? (Ethereum Price Analysis)
Jordan Lyanchev writes Bybit Hack Fallout: Arthur Hayes, Samson Mow Push for Ethereum Rollback
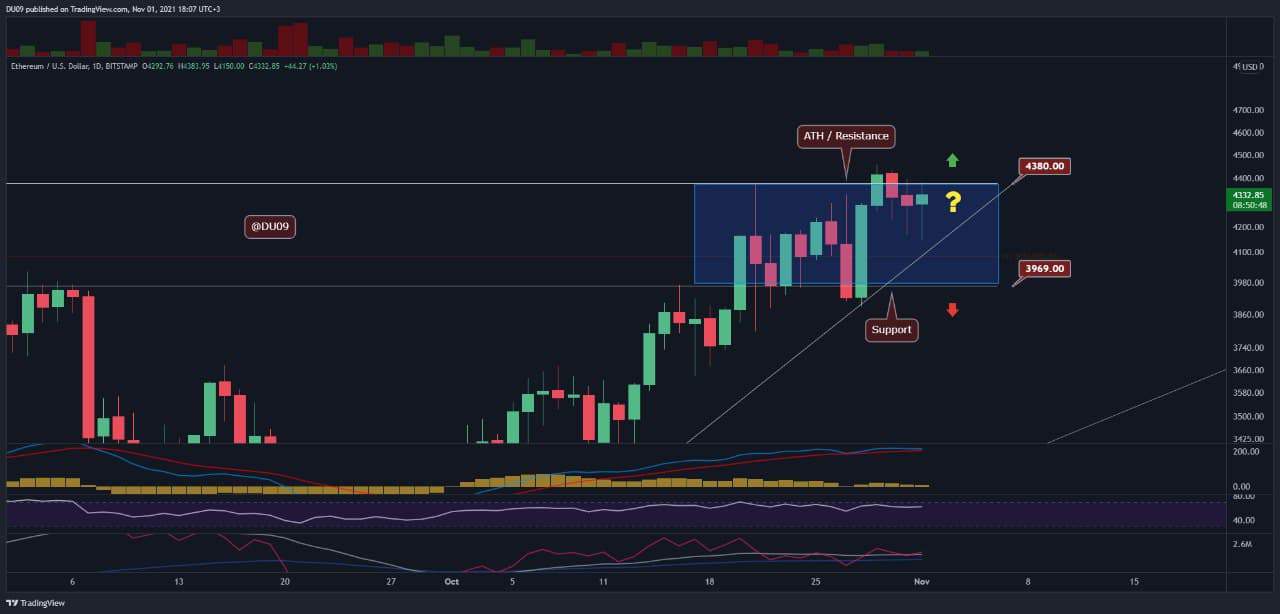
Key Support level: $3,969
Key Resistance level: $4,460
The bulls are attempting another break above the all-time high after the shakeout from 27th October which saw the market take a downturn. After the short-lived correction last week, ETH recovered quickly and has maintained a price above the $3,969 support level. This is a show of strength from the bulls and the bears need to return in force if they stand any chance of reversing this momentum.
ETH Price Technical Indicators
Trading Volume: The recovery from the breakdown last week was on good volume and it has maintained steady since. A push above the all-time high can lead to an explosion in volume and volatility equally.
RSI: The RSI has maintained its level just under 70 points on the daily timeframe which leans on the bullish side. This shows strength and as soon as a breakout takes place, the RSI can spike in the overbought area where it can stay for quite a while if a new rally starts.
MACD: The histogram and the moving averages are bullish on the daily timeframe, however, further delay from the bulls to break above the all-time high may give bears an opportunity to pull price lower and flip the MACD on the bearish side. Currently the histogram is making lower highs, which has to change soon otherwise bears can take over.
Bias
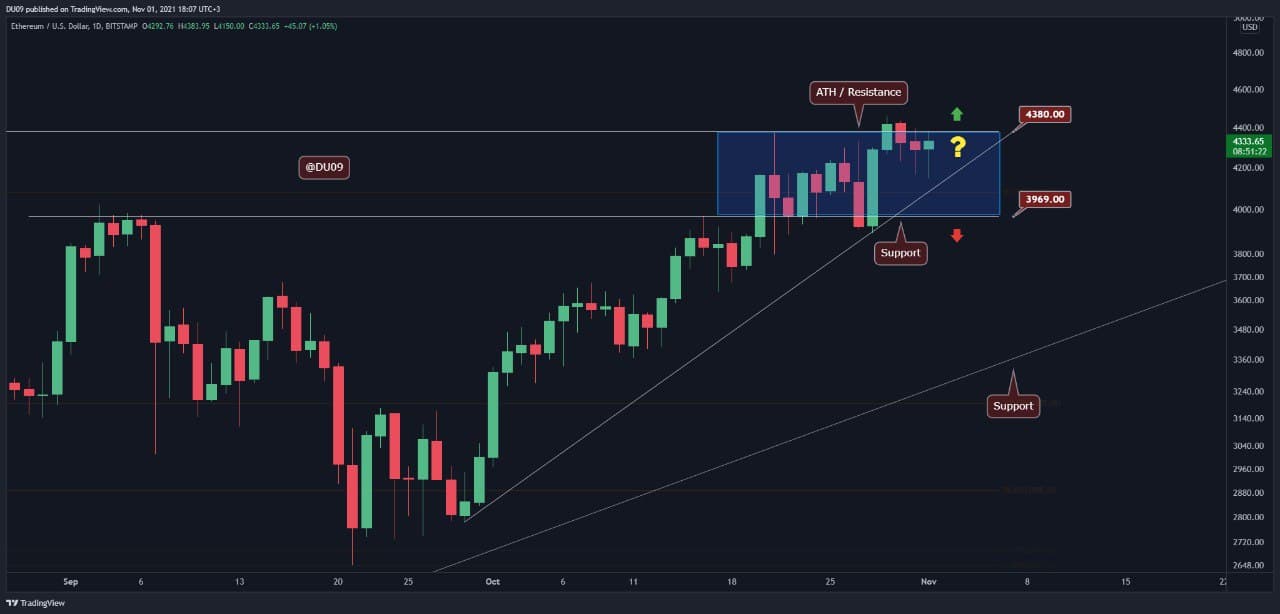
The bias on Ethereum is bullish. As long as the price remains above the key psychological level of $4,000, the bulls have a real chance at breaking above the current all-time high. Bearish bias can only be discussed if ETH closes a daily candle under this key level.
Short-Term Price Prediction for ETH
The expectation is for Ethereum to attempt a new break of the all-time high. This would propel the price quickly to higher levels such as $5,000. Until then, it might remain between the key support and resistance. However, another failure from bulls to break above the all-time high, would embolden the bears and that may lead to another sharp rejection, similar to 27th October.