Key Support level: ,969 , ,500 Key Resistance level: ,380 Ethereum’s (ETH) failure to break the all-time high early this morning quickly changed the market sentiment, and bears took full control for a brief period. In the early hours of this morning, Ethereum attempted to break the all-time high, but it was stopped at ,332 – just below it. Once bulls realized they can’t push the price higher, the action was in the hands of the bears that did not hesitate and pushed it down towards ,000. This led to a breakdown of the formation in blue and a broad market correction where most altcoins crashed by double digits. ETH only dropped 9% and has found support above the ,000 level at the time of this post. This shows buyers have the upper hand at that price level.
Topics:
Duo Nine considers the following as important: ETH Analysis, ETHBTC, Ethereum (ETH) Price, ethusd
This could be interesting, too:
Mandy Williams writes Ethereum Derivatives Metrics Signal Modest Downside Tail Risk Ahead: Nansen
Jordan Lyanchev writes Weekly Bitcoin, Ethereum ETF Recap: Light at the End of the Tunnel for BTC
CryptoVizArt writes Will Weak Momentum Drive ETH to .5K? (Ethereum Price Analysis)
Jordan Lyanchev writes Bybit Hack Fallout: Arthur Hayes, Samson Mow Push for Ethereum Rollback
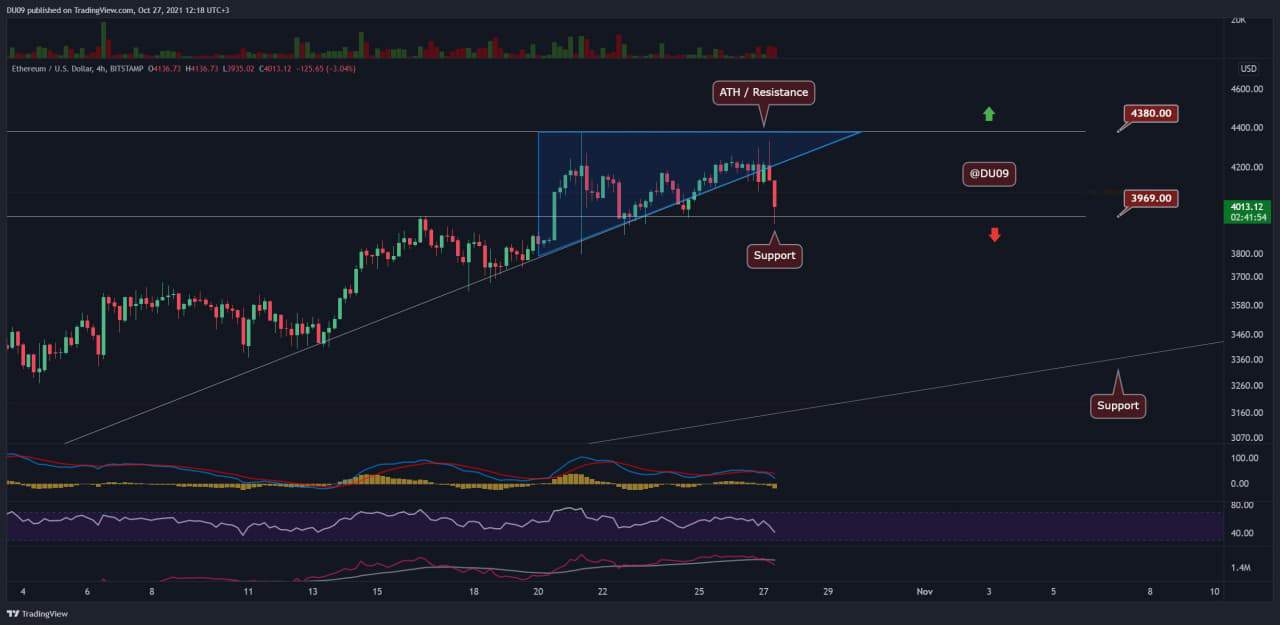
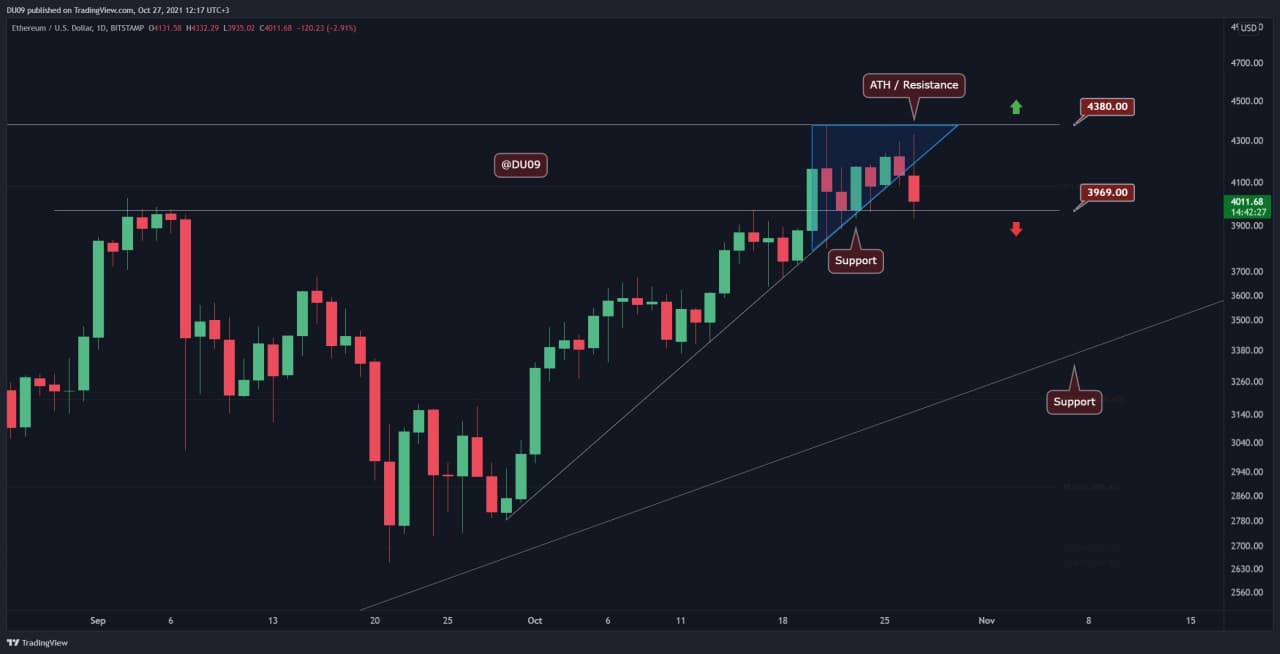
Key Support level: $3,969 , $3,500
Key Resistance level: $4,380
Ethereum’s (ETH) failure to break the all-time high early this morning quickly changed the market sentiment, and bears took full control for a brief period.
In the early hours of this morning, Ethereum attempted to break the all-time high, but it was stopped at $4,332 – just $50 below it. Once bulls realized they can’t push the price higher, the action was in the hands of the bears that did not hesitate and pushed it down towards $4,000.
This led to a breakdown of the formation in blue and a broad market correction where most altcoins crashed by double digits. ETH only dropped 9% and has found support above the $4,000 level at the time of this post. This shows buyers have the upper hand at that price level.
ETH Price Technical Indicators
Trading Volume: Significant volume on the breakdown, indicating some leverage longs may have been liquidated in the process. If this continues, ETH may break the support at $3,969.
RSI: The RSI is falling quickly. However, it is not yet in the oversold area on the 4-hour timeframe. This shows that bulls have another chance to defend the local support and prevent further losses.
MACD: The histogram and the moving averages are bearish on the 4-hour timeframe, and on the daily, they are dangerously approaching a bearish cross. Bears need to push ETH below $4,000 and keep the price there if they hope to take control and push it towards the next key support around $3,500.
Bias
Considering the current price action, the short-term bias is neutral with some signs of bearishness. It is too early to turn bearish because ETH managed to maintain its price above $4,000, despite this sharp drop. This shows bulls have not entirely disappeared and interest in ETH under $4,000 remains high.
Short-Term Price Prediction for ETH
ETH can continue to bounce between the all-time high and the support at around $4,000. This range has to be broken before further volatility can return to push ETH in either direction. The indicators show weakness and favor the bears, but bulls have come in force under $4,000. Therefore it is too early to declare a winner that can take ETH to the next levels of support or resistance.