Key Support levels: ,600, ,300 Key Resistance levels: ,740, 4,000 ETH has just made a lower low on the chart if we exclude the flash crash from 4th December. The price hit the ,600 support level and is now hovering just under the ,740 resistance. The current price action has also formed a large descending wedge (in blue). This is a bullish formation, but it can be quickly invalidated if ETH falls under the key support level. Chart by TradingViewTechnical Indicators Trading Volume: The strong volume during the sell-off is one of the reasons why the price made a lower low. The buying pressure today appears weak and unlikely to break above the current wedge (in blue). RSI: The 4-hour RSI entered into oversold territory (
Topics:
Duo Nine considers the following as important: ETH Analysis, ETHBTC, Ethereum (ETH) Price, ethusd
This could be interesting, too:
Mandy Williams writes Ethereum Derivatives Metrics Signal Modest Downside Tail Risk Ahead: Nansen
Jordan Lyanchev writes Weekly Bitcoin, Ethereum ETF Recap: Light at the End of the Tunnel for BTC
CryptoVizArt writes Will Weak Momentum Drive ETH to .5K? (Ethereum Price Analysis)
Jordan Lyanchev writes Bybit Hack Fallout: Arthur Hayes, Samson Mow Push for Ethereum Rollback
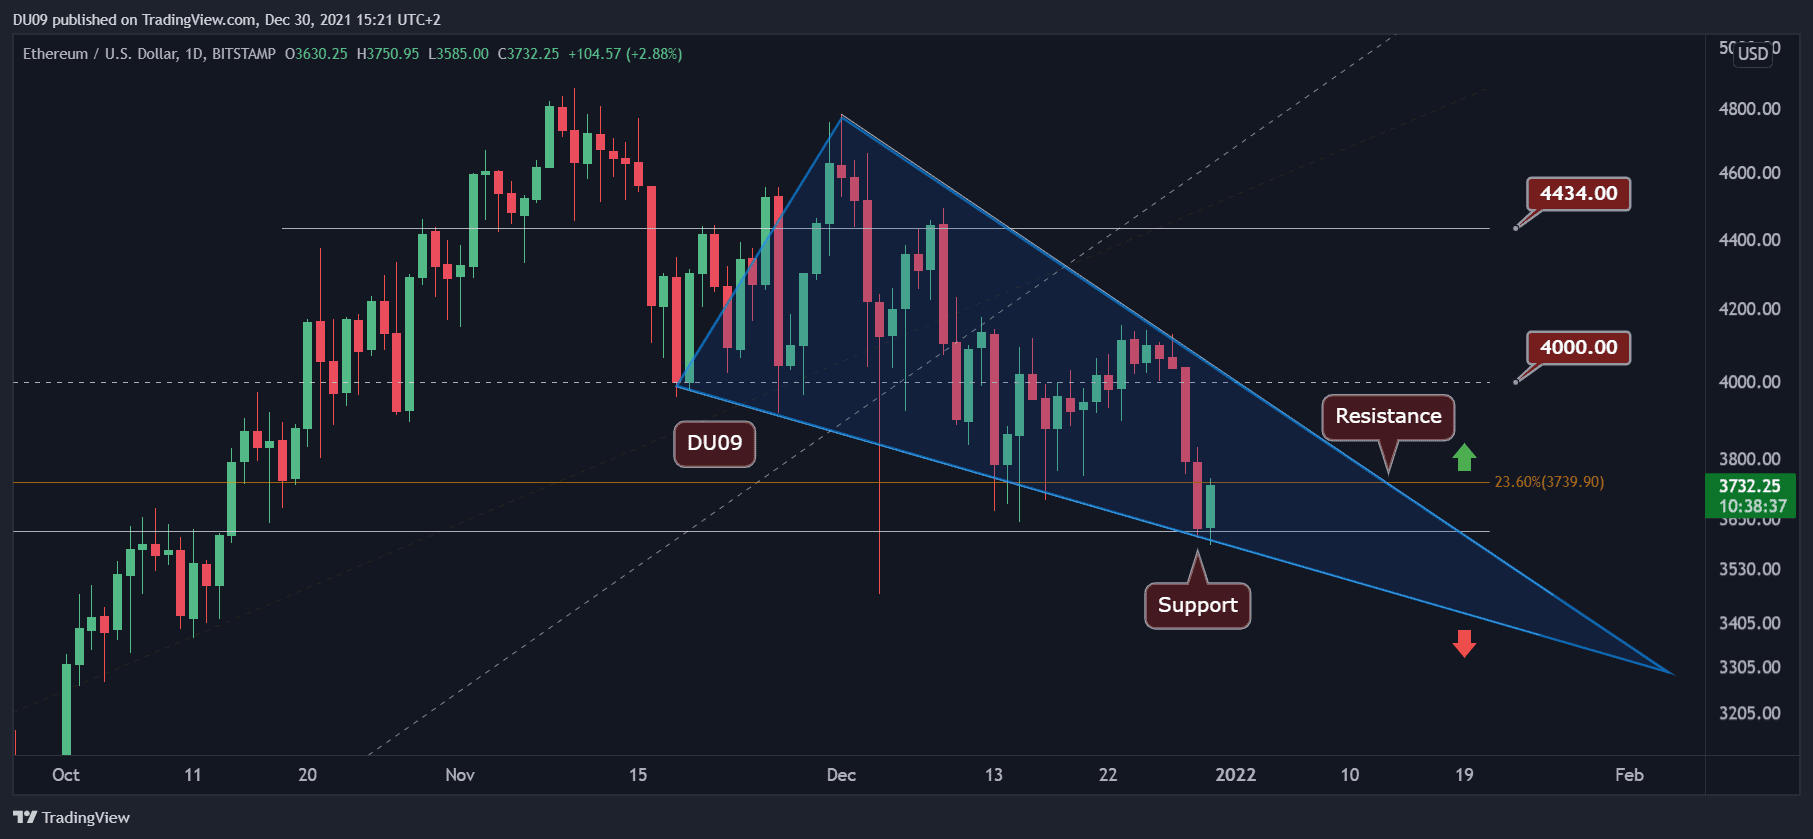
Key Support levels: $3,600, $3,300
Key Resistance levels: $3,740, 4,000
ETH has just made a lower low on the chart if we exclude the flash crash from 4th December. The price hit the $3,600 support level and is now hovering just under the $3,740 resistance.
The current price action has also formed a large descending wedge (in blue). This is a bullish formation, but it can be quickly invalidated if ETH falls under the key support level.
Technical Indicators
Trading Volume: The strong volume during the sell-off is one of the reasons why the price made a lower low. The buying pressure today appears weak and unlikely to break above the current wedge (in blue).
RSI: The 4-hour RSI entered into oversold territory (<30), and the price has bounced from $3,600 as a result. On a daily timeframe, the RSI made a lower low. This is bearish.
MACD: The daily MACD painted a bearish cross yesterday, which isn’t good for the bulls. The only positive aspect is that the histogram has been making higher lows (bullish divergence) since November, when the correction started. This could indicate that this downtrend may come to an end sometime in January.

Bias
The bias for ETH is bearish. The bias will stay bearish as long as ETH fails to make a higher high.
Short-Term Price Prediction for ETH
The current price action looks quite interesting because if the bullish wedge is confirmed, then ETH should rally sometimes in January, making this correction (from November to January) quite similar to the one we had in May-July 2021. This scenario can be invalidated as soon as the price closes a daily candle below the wedge.