ETH has lost the ,000 key level once again. In the following analysis, we will try to understand what it means for the second-largest crypto over the next short term. Key Support levels: ,738 Key Resistance levels: ,000, ,435, ,868 (ATH) After a few days maintaining the crucial level above ,000, ETH’s price dropped below this key price area, which has turned back into solid resistance. The momentum was simply not there to sustain a price above it. As mentioned before, the recent price move was followed by a low amount of trading volume. The current support lies at ,738 and will likely be retested if bulls don’t step up soon. Chart by TradingViewTechnical Indicators Trading Volume: As said before, the volume was extremely low at the start of this week and
Topics:
Duo Nine considers the following as important: ETH Analysis, ETHBTC, Ethereum (ETH) Price, ethusd
This could be interesting, too:
Mandy Williams writes Ethereum Derivatives Metrics Signal Modest Downside Tail Risk Ahead: Nansen
Jordan Lyanchev writes Weekly Bitcoin, Ethereum ETF Recap: Light at the End of the Tunnel for BTC
CryptoVizArt writes Will Weak Momentum Drive ETH to .5K? (Ethereum Price Analysis)
Jordan Lyanchev writes Bybit Hack Fallout: Arthur Hayes, Samson Mow Push for Ethereum Rollback
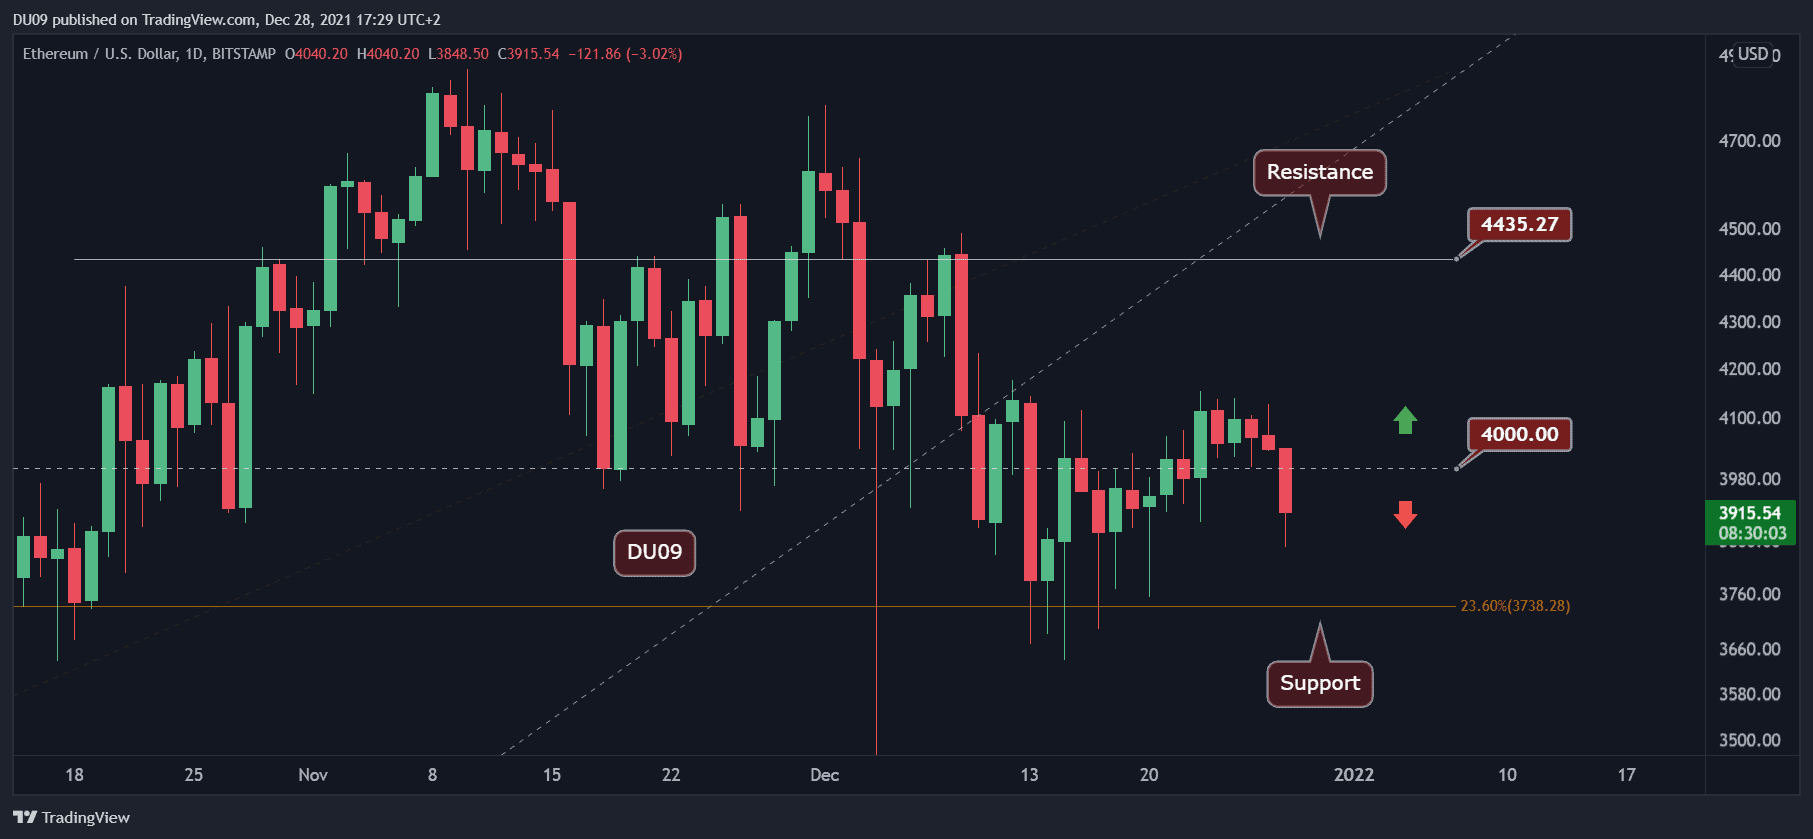
ETH has lost the $4,000 key level once again. In the following analysis, we will try to understand what it means for the second-largest crypto over the next short term.
Key Support levels: $3,738
Key Resistance levels: $4,000, $4,435, $4,868 (ATH)
After a few days maintaining the crucial level above $4,000, ETH’s price dropped below this key price area, which has turned back into solid resistance. The momentum was simply not there to sustain a price above it. As mentioned before, the recent price move was followed by a low amount of trading volume.
The current support lies at $3,738 and will likely be retested if bulls don’t step up soon.
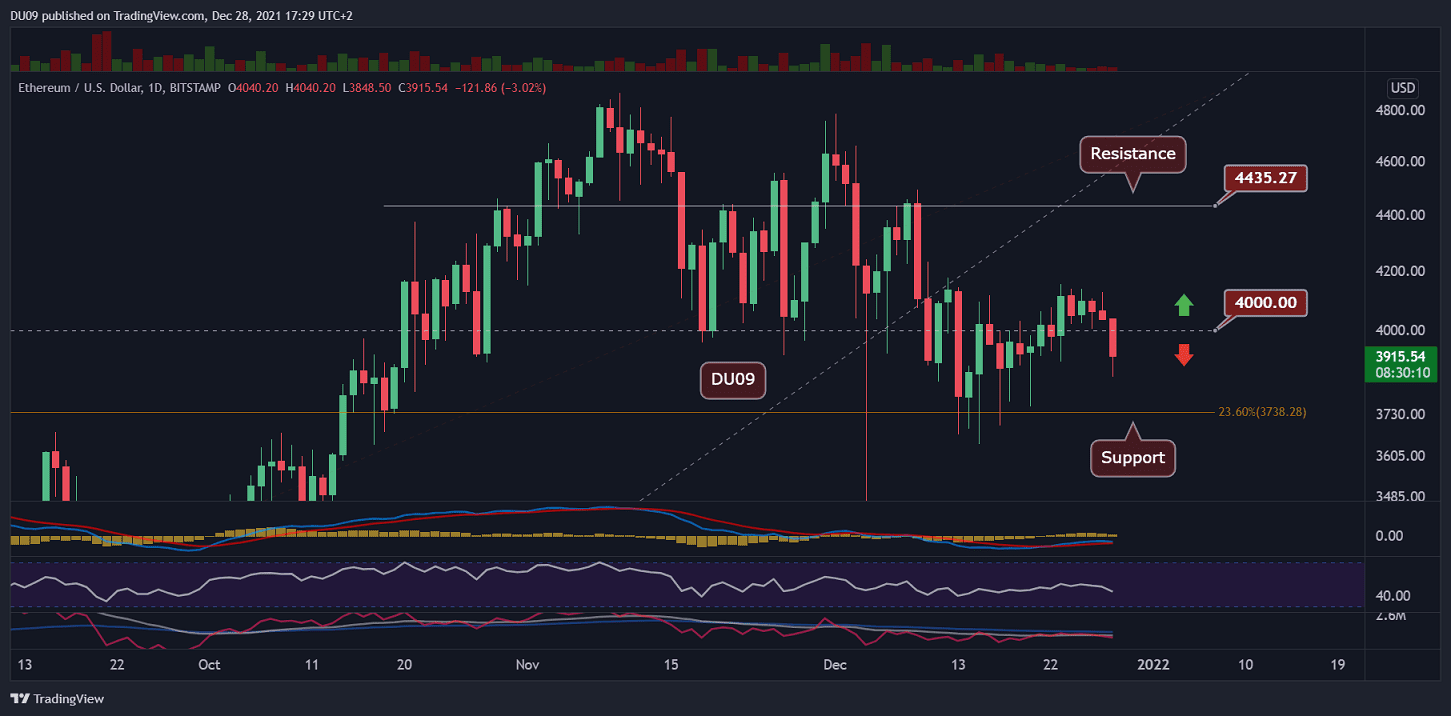
Technical Indicators
Trading Volume: As said before, the volume was extremely low at the start of this week and bears took advantage today. Price slipped on renewed volume, which is bearish.
RSI: The daily RSI is declining as well, and it is under 50 points, indicating that bears are in control of the price action.
MACD: The daily MACD remains bullish and is losing momentum. The histogram and moving averages may soon flip to the bearish side if the current downtrend continues.
Bias
The bias for ETH is bearish right now due to the current price action.
Short-Term Price Prediction for ETH
ETH failed to hold above $4,000. This is a major red flag and may encourage sellers to push ETH lower to the current support at $3,738. It is unlikely that ETH can recover anytime soon; therefore the best hope is for the price to hold above the key support as bulls gather their forces.